The Cautionary View
October 19, 2026

Market Recap
Analyzing the markets with Richie Naso, a Wall Street veteran of over 40 years and former member of the NYSE.
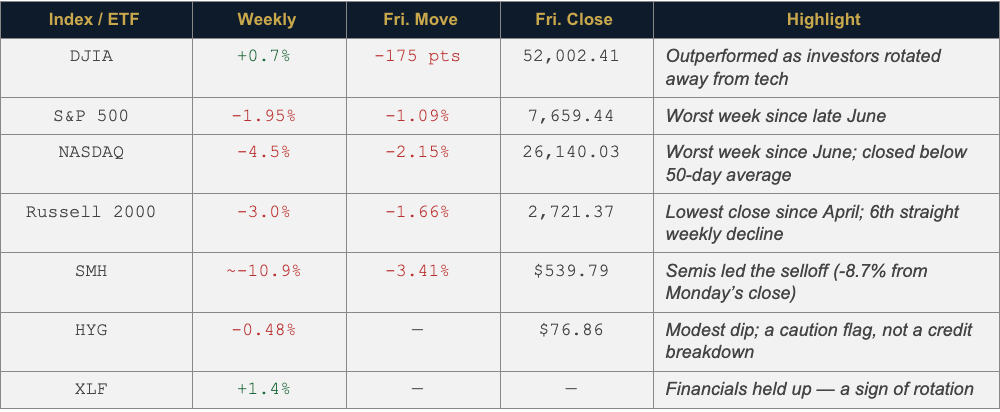
Last Week’s Main Indexes — Let’s Figure This Action Out
Dow Jones Industrial Average
The Dow Jones Industrial Average finished the week higher, gaining approximately 0.7% despite a volatile final two sessions. The index closed Friday at 52,002.41, down 175 points on the day, but still outperformed the broader market as technology and semiconductor stocks came under significant pressure. (Source: AP News)
The primary concern was the growing divergence between the Dow and the technology-heavy indexes. Investors questioned whether massive AI infrastructure investments will generate sufficient returns, triggering another round of selling in chipmakers and other high-growth names. Meanwhile, inflation data remained concerning, and rising oil prices added another layer of uncertainty. (Source: AP News)
Richie’s bottom line: The Dow demonstrated relative strength this week, but Friday’s decline serves as a reminder that selling pressure remains elevated. The Dow’s positive weekly performance is encouraging, yet the weakness across technology and small-cap stocks raises questions about the market’s underlying breadth. I would remain cautious until buyers demonstrate broader participation rather than relying on the resilience of a handful of blue-chip names.
S&P 500
The S&P 500 endured a difficult week, falling approximately 1.95% to close at 7,659.44, marking its worst weekly performance since late June. Friday’s 1.09% decline added to the selling pressure as technology and semiconductor stocks led the market lower. (Source: AP News)
Inflation was a major concern, with September’s CPI report showing a 3.7% annual increase, adding to worries that persistent price pressures could limit the Federal Reserve’s flexibility on interest rates. Meanwhile, concerns about the financing and potential returns on massive AI infrastructure investments weighed heavily on technology shares. (Source: Reuters)
The semiconductor sector was particularly weak, with the Philadelphia Semiconductor Index suffering a sharp decline. Although some traditional sectors, including energy and consumer staples, attracted buying interest, that rotation was not enough to offset weakness in growth-oriented stocks. (Source: Barron’s)
Richie’s bottom line: The S&P’s pullback is a warning that the market’s advance is facing a meaningful test. While the index remains higher for the year, rising inflation concerns, uncertainty over interest rates, and deteriorating technology leadership warrant caution. I would be watching market breadth closely to determine whether this is a healthy consolidation or the beginning of a deeper correction.
Nasdaq
The Nasdaq Composite suffered its worst weekly performance since June, dropping approximately 4.5% to close at 26,140.03. Friday’s 2.15% decline capped a difficult week for technology and semiconductor stocks, as investors reassessed the sustainability of the AI-driven rally. (Source: AP News)
Selling pressure was concentrated in high-growth technology names, particularly chipmakers. Micron fell 5.6% and Intel dropped 5.8% on Friday, reflecting growing concerns about the cost of AI infrastructure investment and the returns companies will ultimately generate. Persistent inflation concerns added to the pressure on valuations. (Source: ABC News)
The technical picture also deteriorated. The Nasdaq closed below its 50-day moving average, while weakening breadth suggested that selling was spreading beyond a handful of major technology stocks. Analysts also pointed to the breakdown of a recent uptrend as a warning that the pullback could extend further. (Source: MarketWatch)
Richie’s bottom line: The Nasdaq was the weakest of the major indexes this week, raising concerns about the durability of technology leadership. Although the longer-term uptrend has not necessarily ended, deteriorating breadth, renewed pressure on semiconductors, and uncertainty surrounding AI spending warrant a more defensive approach. I would look for stabilization in the Nasdaq and improved participation across technology stocks before concluding that the correction has run its course.
SMH — Semiconductors
The VanEck Semiconductor ETF (SMH) had a brutal week, closing Friday at $539.79 — down about 8.7% from Monday’s close of $590.99, and roughly 11% from the previous Friday’s $605.85. The selling accelerated as the week progressed, with SMH losing 3.41% on Friday alone. (Source: Yahoo Finance)
SMH
| Mon | Tue | Wed | Thu | Fri |
| -2.05% | -0.49% | -3.98% | -1.04% | -3.41% |
What drove the decline?
The weakness reflected growing concerns about the sustainability of AI-related spending, the profitability of the massive infrastructure investment, and the impact of persistent inflation and interest-rate uncertainty. Major chip stocks, including Micron and Intel, came under heavy selling pressure. (Source: Investing.com)
Richie’s take: SMH was one of the clearest signs of deterioration beneath the market’s surface. The semiconductor trade had been a major engine of the rally, so this sharp reversal is important — not simply because of the losses in chip stocks, but because of the influence these companies have on the Nasdaq and broader market sentiment.
Russell 2000
The Russell 2000 had a difficult week, falling approximately 3.0% to close at 2,721.37. Small-cap stocks came under sustained pressure, with Friday’s 1.66% decline pushing the index to its lowest closing level since April. (Source: AP News)
This week
| Mon | Tue | Wed | Thu | Fri |
| -0.40% | -0.40% | -1.93% | +1.38% | -1.66% |
What stood out
Thursday’s rebound proved short-lived as sellers returned aggressively on Friday. Small-cap stocks remain particularly sensitive to borrowing costs, economic uncertainty, and investor risk appetite. The weakness is also notable because the Russell’s decline extended its losing streak to six consecutive weeks. (Source: MarketWatch)
Richie’s take: The Russell 2000 is flashing another warning sign for the broader market. Small caps are an important gauge of investor confidence and market participation, and their continued weakness suggests that risk appetite is deteriorating.
HYG — Junk Bond Watch
The iShares iBoxx $ High Yield Corporate Bond ETF (HYG) finished the week lower, closing Friday at $76.86, down approximately 0.48% from its October 9 close of $77.23. The decline was modest compared with the sharp losses in technology and small-cap stocks, but the direction remains worth monitoring. (Source: ChartExchange)
Richie’s take: For now, HYG is a caution flag to watch rather than confirmation of a broader credit breakdown. A sustained decline would strengthen the case for a more defensive market outlook, particularly if it coincides with deteriorating breadth and continued weakness in equities.
Financials — Weekly Recap, October 12–16
Financial stocks showed relative strength during a difficult week for the broader market. The Financial Select Sector SPDR ETF (XLF) gained approximately 1.4% for the week, even as the S&P 500 fell 1.9% and the Nasdaq dropped 4.5%. That outperformance suggests investors were rotating away from high-growth technology stocks and toward other areas of the market. (Source: ChartRow)
What stood out
- Bank earnings were mixed. Goldman Sachs and JPMorgan reported results that initially drew positive reactions, while Wells Fargo faced pressure over its net interest income.
- Regional banks showed resilience. Several regional lenders reported continued loan growth, suggesting business borrowing demand remained firm despite elevated interest rates and inflation concerns. (Source: Reuters)
- Investment banking remained a concern. Slower dealmaking and delayed mergers and IPOs weighed on the outlook for some of Wall Street’s largest banks. (Source: Reuters)
Richie’s take: Financials were a relatively bright spot, but I would distinguish between the strength of the broader sector and the performance of individual banks. Solid loan demand is encouraging, while elevated borrowing costs, inflation, and slower investment-banking activity remain risks.
For the broader market, financials are an important group to watch. If they continue to hold up while technology and small caps weaken, that would indicate rotation rather than indiscriminate selling. However, I would want to see sustained strength across the sector — including regional banks — before treating this as evidence of a healthier, broad-based market.
This Week's Interesting Sector Piece: Utility Stocks Offer Nice Yields and Are Less Risky Than Other AI Plays
Source: Barron’s, print edition, p. 11 — Andrew Bary, October 19, 2026. The stocks, funds, and analyst views referenced below are drawn from that article and are included for informational and educational purposes only. They are the views of Barron’s and the analysts quoted, not TradeZero or Richard Naso, and do not constitute investment advice or a recommendation to buy or sell any security. Prices, yields, and estimates are as of the article’s publication date. Past performance is not indicative of future results.
Electric utility stocks are having a tough year, but Barron’s argues they offer good value at current prices. After a challenging third quarter, these stocks have dividend yields of around 3% and prospects of mid- to high-single-digit annual earnings growth in the coming years. (Source: Barron’s)
The sector shed its stodgy reputation over the past two years as U.S. power demand rose to meet artificial-intelligence compute. Utilities are upgrading often antiquated generation and distribution infrastructure and building new power plants. Electric utility stocks returned about 15% in 2025 as they turned into plays on the data-center boom, particularly independent power companies such as Constellation Energy.
This year has been rougher. Higher interest rates, regulatory concerns, and a bipartisan political pushback against data centers have weighed on many of the stocks. But whereas AI-dependent chip stocks and CoreWeave, a leveraged play on the data-center buildout, have been hit hard in recent sessions, utility stocks are holding up. The State Street Utilities Select Sector SPDR (XLU), the largest utility ETF, has risen 6% in October after dropping 13% in the third quarter, and is now down 2% this year.
Industry bulls point to lower valuations and annual earnings-growth projections for major utilities in the 6% to 9% range through 2030.
“Price/earnings multiples are about the same as they were when interest rates were this high in the early 2000s. But the market is missing that utilities have twice the growth than they did then.” — Jay Rhame, Chief Executive Officer, Reaves Asset Management
If the technology stocks that dominate the S&P 500 start to crumble — and there have been some cracks recently — defensive industries like utilities could benefit, the article suggests. Major utilities such as NextEra Energy, Duke Energy, Southern Co., and American Electric Power trade for an average of close to 19 times projected 2026 earnings and 18 times 2027 profits. Exposure to the sector is available through ETFs such as the State Street Utilities Select Sector SPDR and Vanguard Utilities (VPU), and closed-end funds such as Reaves Utility Income (UTG).
Some analysts say investor concerns about a data-center backlash are overdone, given existing contracts with tech giants such as Meta Platforms and Microsoft.
“There has never been a bigger disconnect between management and their conviction on rising growth and what investors fear.” — Steve Fleishman, Analyst, Wolfe Research
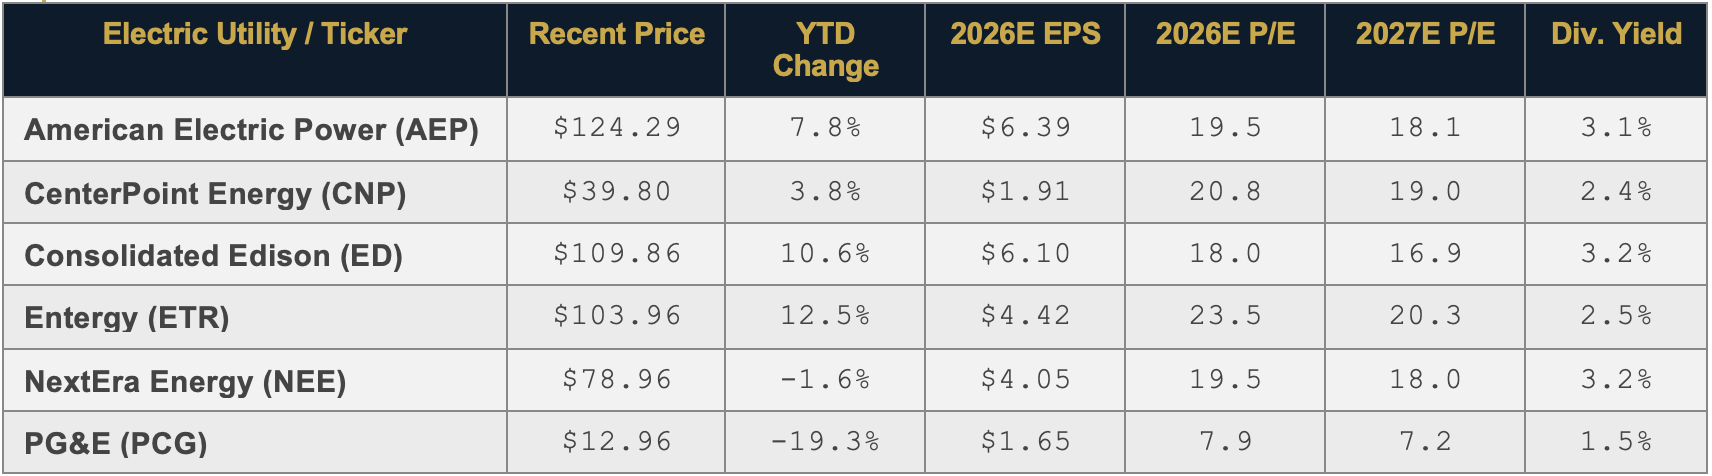
Key Metrics for the Sector (cited by Barron’s)

E = estimate. Sources: Bloomberg, company reports, via Barron’s. Data as of the article’s publication date and subject to change. Tables are illustrative only and are not a recommendation of any security.
The risks
Another negative is interest rates. The 10-year Treasury yield is up about a percentage point this year to 5.10%, offering a safe and competitive yield relative to utilities. The yield gap between the 10-year Treasury note and the State Street Utilities Select Sector SPDR has widened about 0.75 percentage point this year to more than two percentage points — one of the widest spreads in the past 20 years, according to Mizuho utility analyst Anthony Crowdell.
“Utilities remain a bond proxy and that is a problem into year-end.” — Anthony Crowdell, Utility Analyst, Mizuho (client note)
A counterargument, says Citigroup analyst Ryan Levine, is that utilities are now retaining more earnings for growth, making the Treasury/utility dividend comparison less important.
The political backdrop has also worsened, as politicians of both parties focus on higher electric rates, which have risen 6% annually over the past five years. That could make it harder for regulated utilities to earn adequate returns on investments in new generating facilities, transmission lines, and other infrastructure.
Who has data-center exposure
Traditional utilities with the most exposure to data-center growth include Entergy and NiSource. NextEra Energy, American Electric Power, CenterPoint Energy, and Duke Energy are large and offer a more diluted play, while utilities such as Consolidated Edison in New York and Eversource in New England have little exposure to the AI boom. The purer AI plays are independent power producers Constellation Energy and Vistra.
What the analysts favor
Analyst preferences cited by Barron’s are third-party opinions and are not a guarantee of future performance.
- Ryan Levine, Citigroup: likes NextEra Energy, which has a large renewable-energy portfolio and owns Florida Power & Light, one of the country’s largest utilities. NextEra has a deal to buy Dominion Energy. At around $79, NextEra trades for about 18 times next year’s projected earnings and yields over 3%.
- Steve Fleishman, Wolfe Research: is partial to Houston-based CenterPoint, which has exposure to the growing Texas economy, and American Electric Power, the big Midwest company operating in nearly a dozen states.
- Sophie Karp, KeyBanc, wrote recently that Entergy and NiSource are two of the best plays on data-center growth. Entergy has one of the industry’s highest multiyear earnings-growth outlooks, at 10%-plus annually through 2030 — reflected in a high P/E of 20 times next year’s projected earnings.
The deep-value case: PG&E
The article also highlights PG&E as a deep-value but high-risk situation. The stock dropped 30% in late August when the California legislature failed to provide state utilities with wildfire legal protection supported by Gov. Gavin Newsom. Analysts are wary of the stock, which trades for just eight times projected 2026 earnings — less than half the industry average — because of the liability risk. (Source: Barron’s)
“The liability policy needs to be resolved.” — Patti Poppe, CEO, PG&E, to Barron’s
Whether that legislation passes, Barron’s notes, is no sure thing.
On My Radar This Week: What I’ll Be Focused On This Week
The items below reflect Richard Naso’s personal areas of focus for the coming week and are provided for informational and educational purposes only. They do not constitute investment advice or a recommendation to trade any security.
WATCH LIST — WEEK OF OCTOBER 19, 2026
- From Tuesday — Earnings Season Moves Into High Gear — Roughly 70 S&P 500 companies report results this week.
- Friday — Manufacturing PMI and Services PMI — A fresh read on business activity heading into the end of the month.
Final Thoughts: Richie’s Take
Last week’s price action has made me increasingly concerned about the market’s near-term direction. The sharp selloff in the Nasdaq and semiconductors, continued weakness in the Russell 2000, and deterioration in market breadth suggest that the selling may be broader than a routine pullback. While the Dow and financial stocks have shown relative resilience, that strength has not been enough to offset the weakness elsewhere.
My biggest concern is market breadth and the lack of broad-based participation. A healthy market needs more than a handful of large-cap stocks to carry the major indexes. When technology, semiconductors, and small caps begin to weaken simultaneously, it raises questions about the underlying strength of the rally. I will also be watching HYG closely for any signs that weakness in equities is beginning to spill over into the high-yield credit market.
A sharp decline can certainly produce a short-covering rally, and I would not be surprised to see an oversold bounce. However, I am reluctant to interpret a few positive sessions as evidence that the market has found a bottom. I want to see improving breadth, stabilization in semiconductors, and stronger buying conviction before becoming more constructive.
For now, I believe the risk-reward equation has become less attractive. Rather than chasing a rally or assuming every dip is a buying opportunity, I would favor patience, disciplined risk management, and a more selective approach. The longer-term outlook may still offer opportunities, but the near-term technical picture is deteriorating, and the possibility of a deeper correction should not be dismissed.
— Richie
Disclaimer
This content (“Content”) is produced by Richard Naso. The Content represents only the views and opinions of Mr. Naso who is compensated by TradeZero for producing it. Mr. Naso’s trading experiences and accomplishments are unique, and your trading results may vary substantially from his. TradeZero does not endorse the Content and makes no representations or warranties with respect to the accuracy of the Content or information available through any referenced or linked third party sites. The Content has been made available for informational and educational purposes only and should not be considered trading or investment advice or a recommendation as to any security. Trading securities can involve high risk and potential loss of funds. Furthermore, trading on margin is for experienced investors and traders only as the amount you may lose can be greater than your initial investment. Likewise, short selling as a securities trading strategy is extremely risky and can lead to potentially unlimited losses. Options trading is not suitable for all investors as it can involve risk that may expose investors to significant losses. Please read the Characteristics and Risk of Standardized Options, also known as the options disclosure document (ODD)at before deciding to engage in options trading.
TradeZero provides self-directed brokerage accounts to customers through its operating affiliates: TradeZero America, Inc., a United States broker dealer, registered with the SEC and member of the Financial Industry Regulatory Authority (FINRA) and the Securities Investor Protection Corporation (SIPC); TradeZero, Inc., a Bahamian broker dealer, registered with the Securities Commission of the Bahamas; TradeZero Canada Securities ULC, a Canadian broker dealer, member firm of Canadian Investment Regulatory Organization (CIRO) and member of the Canadian Investor Protection Fund (CIPF); and TradeZero Europe B.V., a Dutch broker dealer, authorized and regulated by the Netherlands Authority for the Financial Markets (AFM) and subject to the regulatory framework of the European Securities and Markets Authority (ESMA) under MiFID II (collectively, the “TradeZero Broker Dealers”).