Data-Driven Execution | When Price Action Invalidates Technical Indicators
November 17, 2026

Trading Strategies with Bob Iaccino
Bob Iaccino, Chief Market Strategist and Co-Founder of Path Trading Partners, with 30 years' experience working as an active investor in equities, commodities, futures and FX, Bob brings extensive practical experience to the subject of risk management.
Key Points at a Glance
- Price is the only fact you can confirm. Indicators are built from past prices and lag.
- The same signal means different things near support and directly below resistance.
- The close is the most important of a candle's four data points. Trading through a level is not the same as closing beyond it.
- A setup that never confirmed is different from one that confirmed and then failed.
- Define the timeframe, the level, the confirmation and the invalidation before entering, then follow them.
- Oversold means the indicator is oversold, not that price has bottomed.
Why Price Gets the Last Word Over Indicators
In trading, technical indicators help you organize information, measure momentum, and evaluate trends. But they don’t get the final say. Price does. In trading, price is the one thing you know for certain. News can be wrong, and indicators can glitch, but when a trade happens at a price, you know that asset traded there. Price is the only “fact” you can confirm. Most Indicators are based on past prices, so they can take time to catch up to market changes. So, when price contradicts a setup, price is not wrong. You can’t assume it will reverse to make the indicator right again. You have to reconsider the setup.
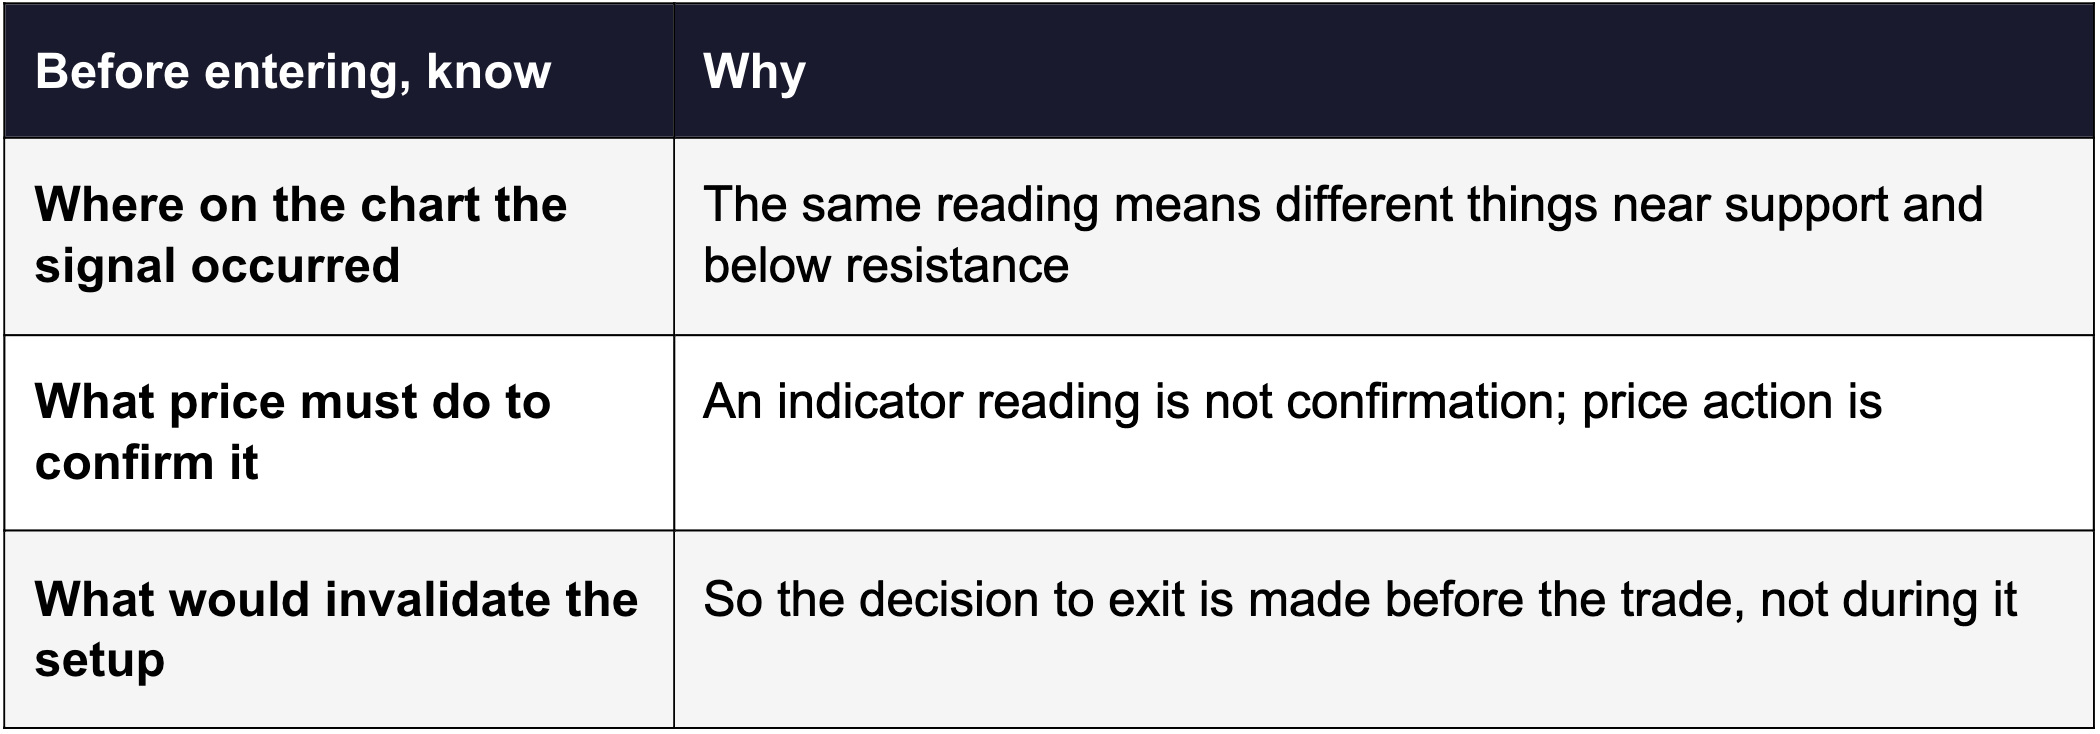
The rule is straightforward. Price action comes first, and indicators help support the decision. But that takes more than watching whether price goes up or down. Before entering a trade, you need to know where on the chart a signal occurred, what price must do to confirm it, and what would invalidate the setup.
Location Matters as Much as the Signal
A bullish indicator reading does not mean the same thing everywhere on a chart. A signal near established support is different from the same signal directly below resistance. Support and resistance show you where buying or selling pressure has appeared before. That gives you context you cannot get from the indicator alone.
Two Bullish Signals, Two Different Trades
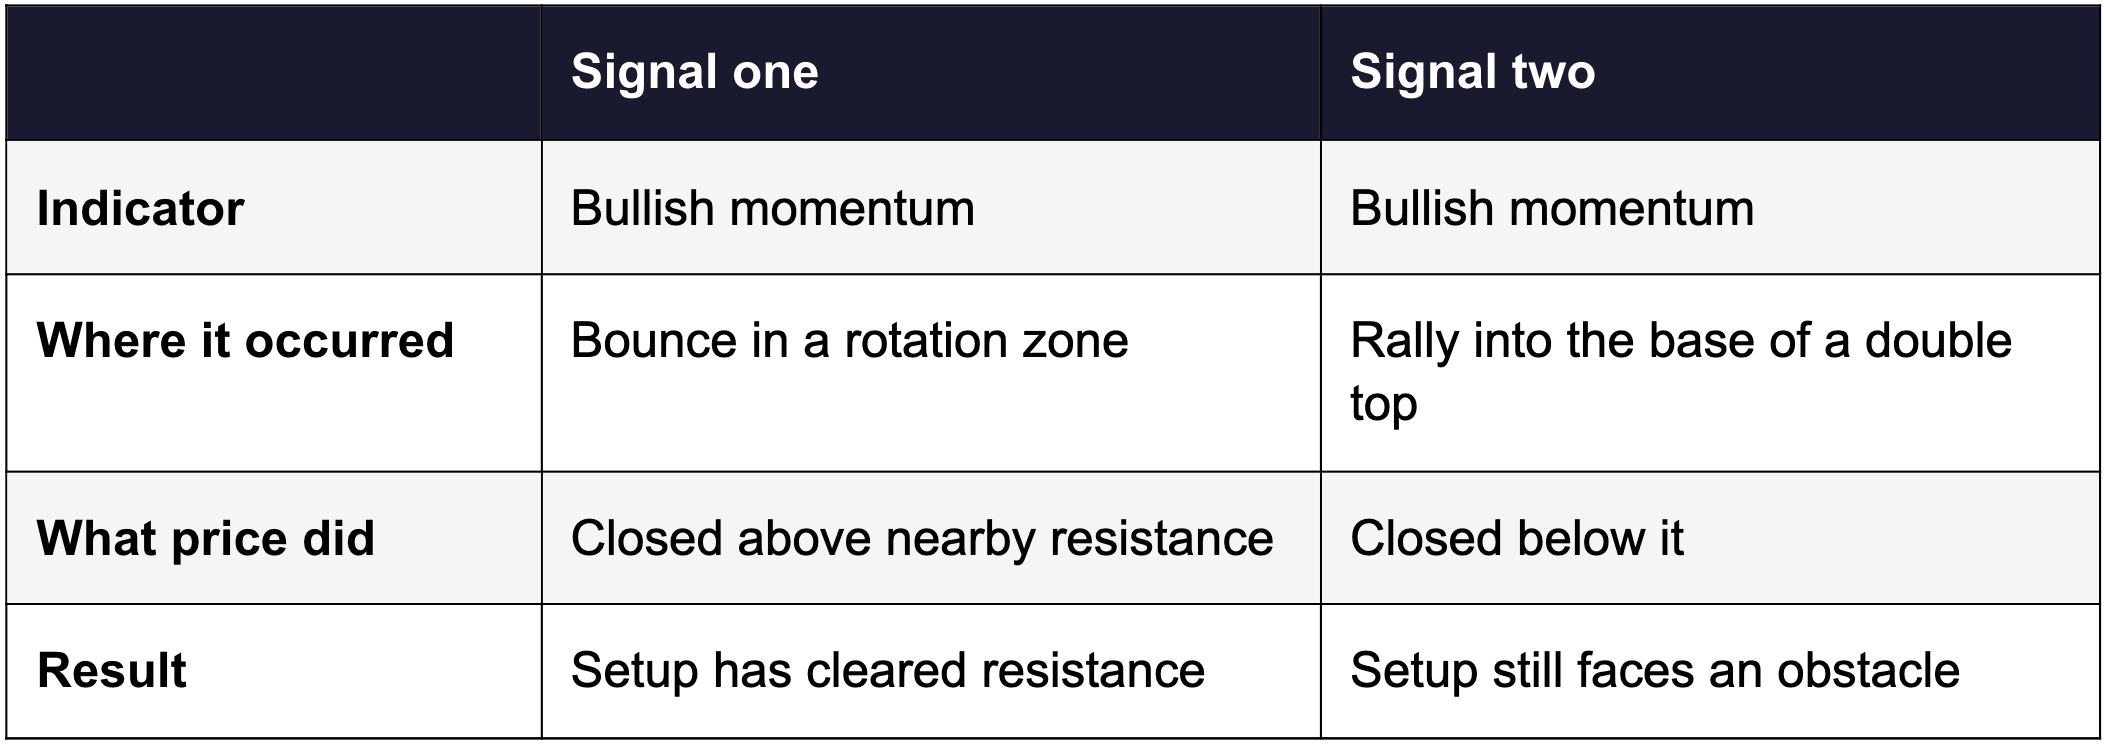
Consider two bullish momentum signals. In one case, price bounces in a rotation zone and closes above nearby resistance. In the other, price rallies into the base of a double top but closes below it. The indicator might look similar in both cases, but price has done two different things. One setup has cleared resistance. The other still faces an obstacle.
Indicators Are the Sauce. Price Action Is the Pasta.
Before acting, identify the areas that form previously researched support and resistance. Reading what an indicator is telling you is only part of the process. You also need to ask where it happened and what price actually confirmed. Indicators are the sauce, the garlic, and the Parmesan cheese. Price action is the pasta.
Why the Candle’s Close Matters
Trading through a level does not necessarily mean price has broken it and will stay beyond it. Price can move above resistance, bring in breakout buyers, and then finish back below your key level. It can also trade below support and reverse, trapping traders who thought the initial move confirmed the break. Every bar or candle immediately shows you four important pieces of price action: an open, a high, a low, and a close. The close is the most important.
What the Closing Price Tells You
The close matters because it shows where buyers and sellers settled the price after reacting to all the information available up to that point. On any chart, the closing price is the final result of that time period’s trading, given everything that’s known at that time. All that back-and-forth results in the closing price.
Never Confirmed vs. Confirmed and Failed
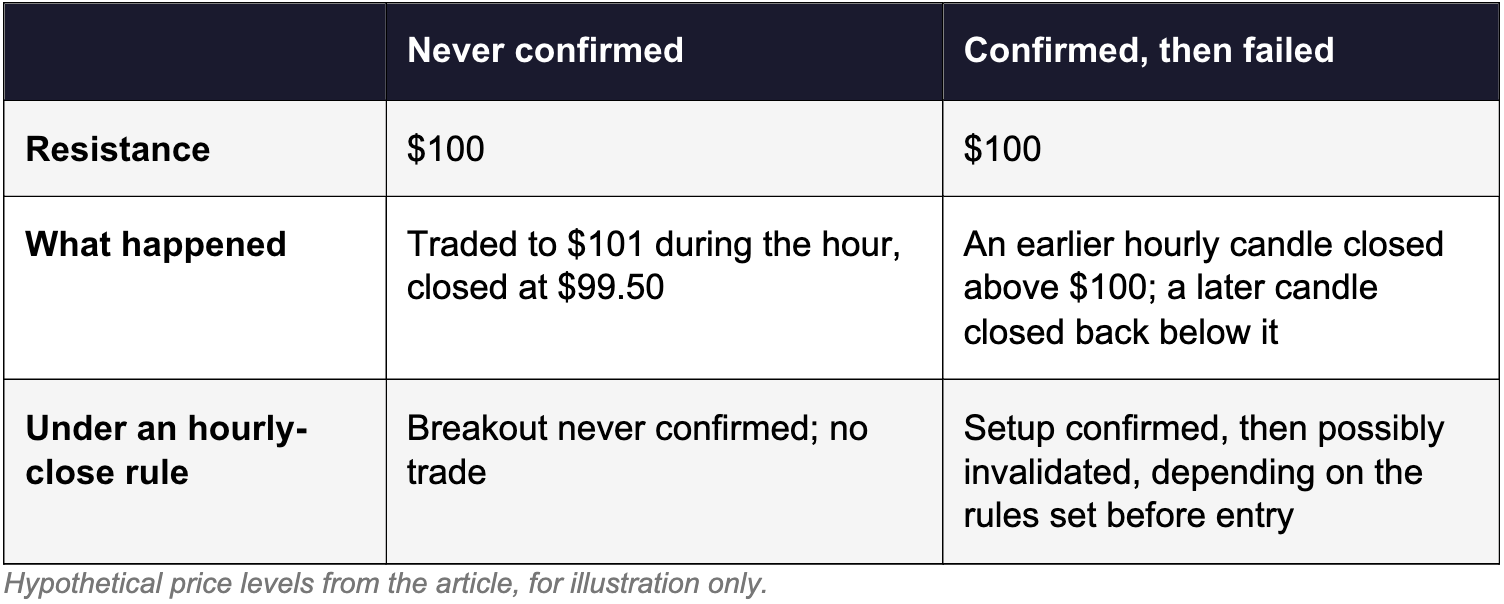
Say resistance is $100. Price trades up to $101 during the hour but closes at $99.50. If your rule requires an hourly close above $100, that breakout never confirmed. Now suppose an earlier hourly candle had already closed above $100. A later close back below it could invalidate the setup, depending on the rules established before entry.
Those are two different situations. A setup that never confirmed is not the same as one that confirmed and then failed.
Mechanical Rules for Identifying False Signals
Here is one way you turn that thinking into rules you can actually follow:
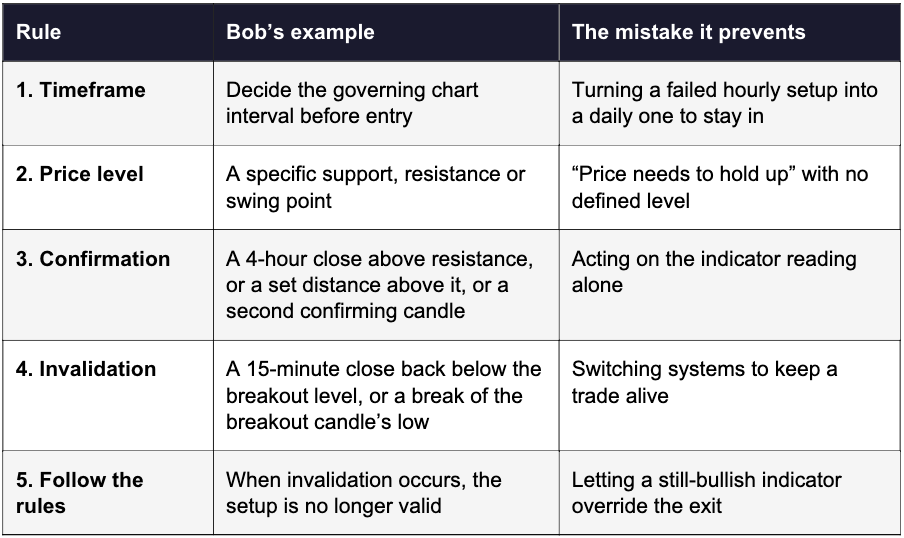
- Define the timeframe. Decide which chart interval governs your trade before entering. If an hourly setup fails, don't suddenly turn it into a daily setup just because you want to stay in the position.
- Mark the price level. Identify the support, resistance, or swing point the setup depends on. “Price needs to hold up” is too vague. You need a specific level and a clear rule for what holding it means.
- Define confirmation. For example, you might require a 4-hour close above resistance before acting on a bullish indicator signal. If you require that close to be a certain distance above that level or you need another confirming candle, establish that beforehand.
- Define invalidation. Your main strategy might need a 15-minute close back below the breakout level to invalidate a confirmed setup. A secondary strategy might use a break below the breakout candle’s low. Each can be a rule, but don’t switch between systems to keep a trade alive.
- Follow the rules. When the invalidation condition occurs, the setup is no longer valid. An indicator that still looks bullish does not override that.
What These Rules Can and Can’t Do
These are examples of a rule set, not guaranteed rules for every system. Waiting for a close or requiring additional confirmation can help filter out temporary moves through a price level. It will not eliminate every false signal.
Example: Don’t Confuse Oversold With a Buy Signal
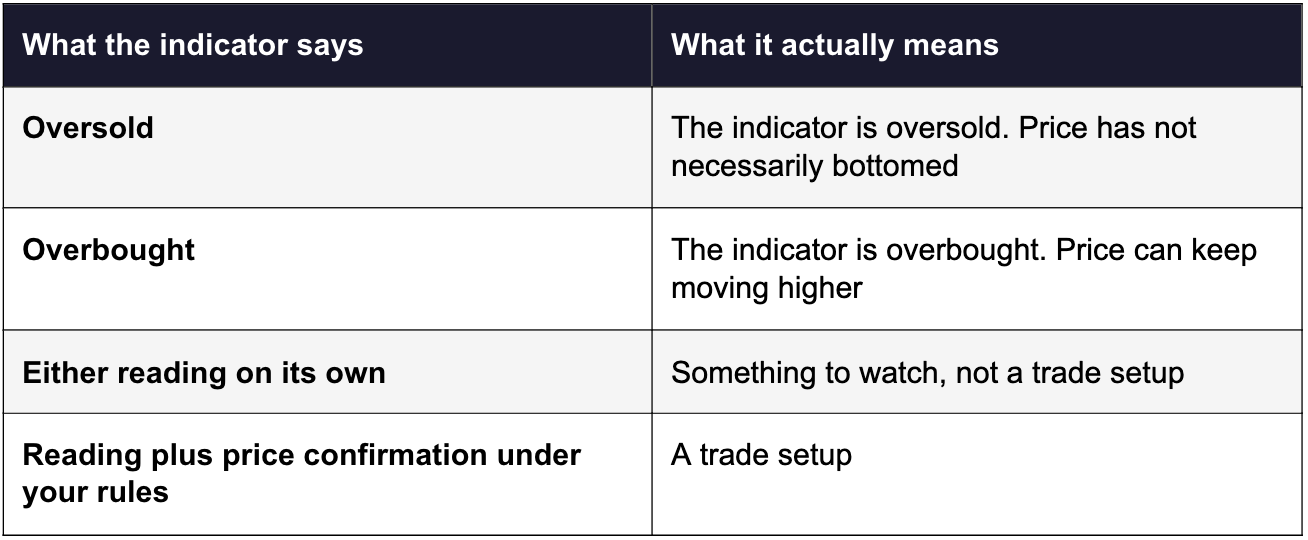
Oversold does not mean price has bottomed. It means the indicator is oversold. Buying on that reading alone can put you on the wrong side of a strong downtrend. The same goes for selling simply because an indicator is overbought while price keeps moving higher.
You still need price action to confirm a setup. That might mean price breaking above a support level before you act on oversold conditions. Until then, you have something to watch, but you don't have a trade setup.
Price Gets the Final Say
An indicator can tell you to pay attention, but price action determines whether you have a trade. If price confirms the signal, you can act according to your rules. If price invalidates the setup, you can’t ignore that just because the indicator still looks bullish or bearish.
The Tradeoff of Waiting for Confirmation
Waiting for price confirmation can mean entering later and giving up part of a move. That is the tradeoff. You are giving price a chance to show whether it supports what the indicator is telling you. A closing price is one way (but not the only way) to make that judgment.
The goal is not to prove an indicator right or wrong. The goal is to know when price supports the trade and when that support is gone. Indicators describe conditions. Your price rules determine when you act.
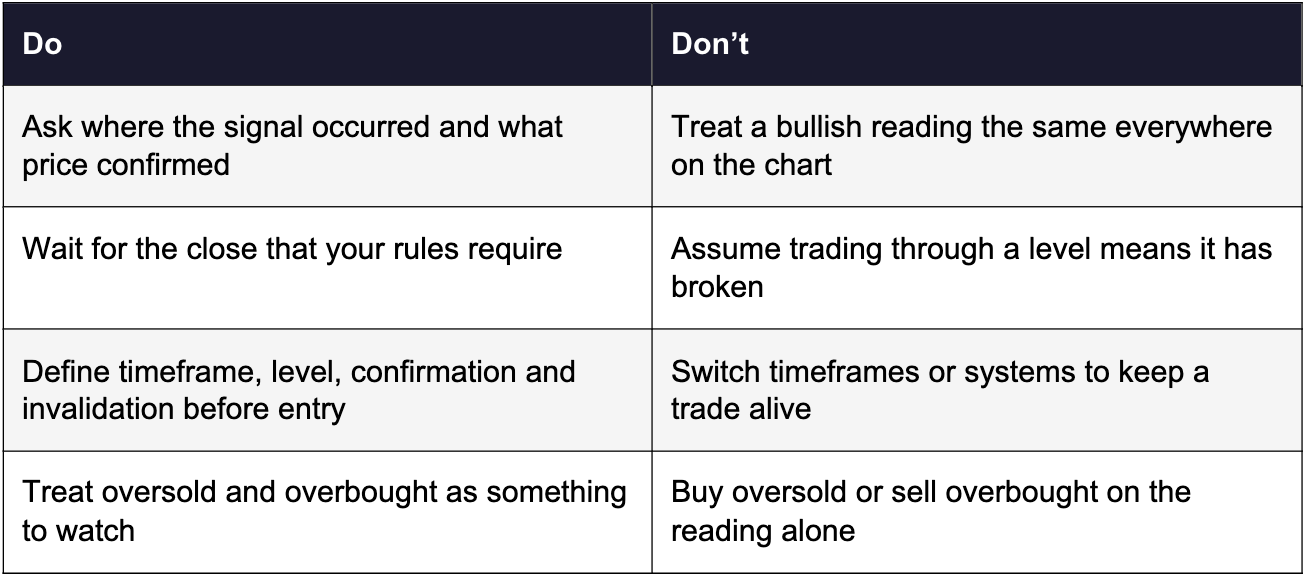
Price Action vs. Indicators: Do’s and Don’ts
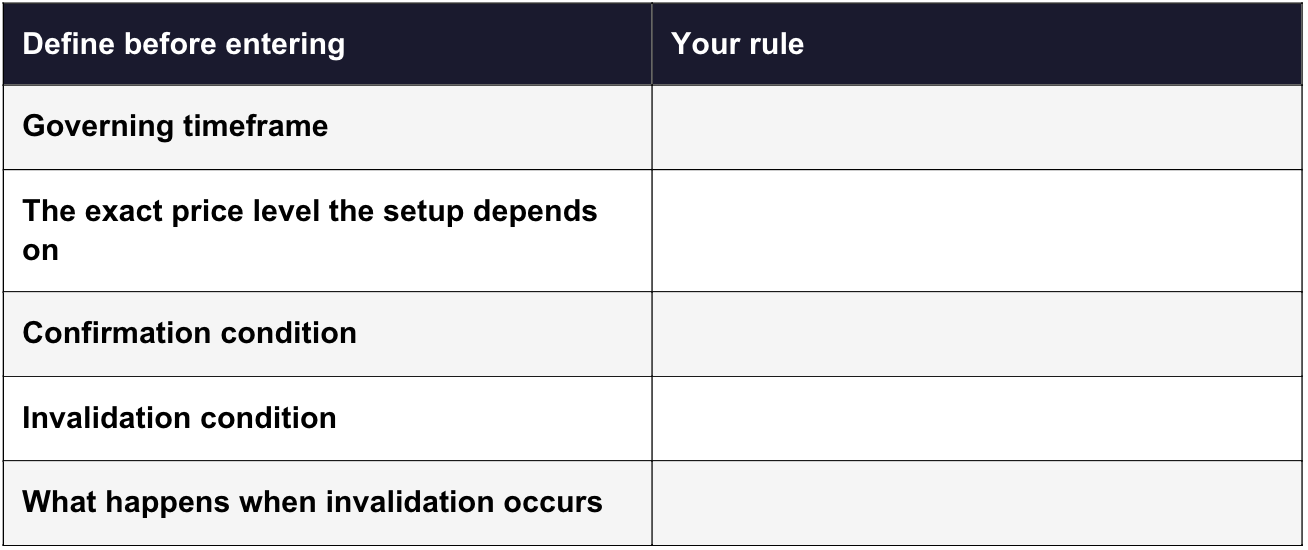
Your Pre-Trade Rules Worksheet
Frequently Asked Questions About Price Action and Indicators
Why does price action come before technical indicators?
Because price is the one thing you know for certain. News can be wrong and indicators can glitch, but when a trade happens at a price, that asset traded there. Most indicators are built from past prices, so they take time to catch up. When price contradicts a setup, price is not wrong; the setup needs reconsidering.
What does it mean when price action invalidates an indicator?
It means price has done something the setup said it shouldn't. If your rules required a close above resistance and price closed back below it, the setup is invalid even if the indicator still looks bullish. You cannot assume price will reverse to make the indicator right again.
Does the same indicator signal mean the same thing everywhere on a chart?
No. A bullish reading near established support is different from the same reading directly below resistance. Support and resistance show where buying or selling pressure appeared before, which is context the indicator alone cannot give you.
Why is the candle close more important than the high or low?
Every candle shows an open, a high, a low and a close. The close is where buyers and sellers settled after reacting to everything known in that period. Price can trade through a level during the bar and finish back on the other side, so the close is what tells you whether a level actually held or broke.
What is the difference between a setup that never confirmed and one that failed?
If resistance is $100 and price trades to $101 but closes at $99.50, a rule requiring a close above $100 never confirmed. If an earlier candle had already closed above $100 and a later one closed back below, the setup confirmed and then failed. They are different situations and should be treated differently under your rules.
How do I set rules for identifying false signals?
Bob's example rule set has five parts: define the timeframe that governs the trade, mark the exact price level the setup depends on, define what confirmation looks like, define what invalidates the setup, and follow those rules when the invalidation condition occurs.
Why should the timeframe be fixed before entering?
Because changing it mid-trade is a way of avoiding a decision. If an hourly setup fails, turning it into a daily setup just to stay in the position is switching systems to keep a trade alive. In day trading, where several timeframes are on screen at once, deciding the governing interval beforehand is what stops that drift.
What is a confirmation rule?
A specific condition price must meet before you act on the signal. For example, requiring a 4-hour close above resistance before acting on a bullish indicator, or requiring that close to be a certain distance above the level, or waiting for a second confirming candle. Whatever it is, establish it beforehand.
What is an invalidation rule?
A specific condition that ends a confirmed setup. Bob's example is a 15-minute close back below the breakout level. A secondary system might use a break below the breakout candle's low. Either can be a rule; the point is not to switch between them to keep a trade alive.
Does waiting for a close eliminate false signals?
No. Waiting for a close or requiring extra confirmation can filter out temporary moves through a level, but it will not eliminate every false signal. Bob presents his five rules as examples of a rule set, not guaranteed rules for every system.
Is an oversold reading a buy signal?
No. Oversold means the indicator is oversold, not that price has bottomed. Buying on that reading alone can put you on the wrong side of a strong downtrend, and the same goes for selling simply because an indicator is overbought while price keeps rising. You still need price action to confirm.
Does this apply to overbought readings and short trades?
Yes. Selling because an indicator is overbought while price keeps moving higher is the mirror image of buying oversold in a downtrend. For short selling, the same discipline applies: the overbought reading is something to watch, and the trade exists only once price confirms it under your rules.
What is the tradeoff of waiting for price confirmation?
Entering later and giving up part of the move. Bob accepts that cost in exchange for letting price show whether it supports what the indicator is saying. A closing price is one way to make that judgment, though not the only way.
How do indicators and price action work together?
Indicators describe conditions and tell you to pay attention. Price rules determine when you act. As Bob puts it, indicators are the sauce, the garlic and the Parmesan cheese; price action is the pasta.
How do I find candidates where price and indicators are lining up?
A stock scanner can filter for the indicator condition; momentum, oversold or overbought readings - but that is only the first step. Each candidate still has to be checked on the chart for where the signal occurred relative to support and resistance and what price has actually confirmed.
Should a day trader use indicators at all?
Yes, for what they are good at: organizing information, measuring momentum and evaluating trends. For a day trader the mistake is letting an indicator override what price has done. Bob's framework keeps the indicator as support for the decision rather than the decision itself.
Does the location of the signal matter for costs?
A signal that has already cleared resistance and one that still faces an obstacle are different trades, and the second often produces more stop-outs. Each failed entry carries commissions and fees as well as the loss, so at a low cost brokerage those false signals are cheaper, but they are still better avoided by checking location before acting.
Related Reading From This Series
- Support and Resistance: How to Read the Levels That Matter
- Trading the Rotation Zone: Identifying Dynamic Support and Resistance Through EMA Confluence
- Double Tops and Double Bottoms
- Multi-Timeframe Analysis: Which Trend Are You Trading?
Disclosure
This Blog (hereafter referred to as the "Content") is produced by TradeZero. The Content may include the views and opinions of TradeZero and a third-party participant, Bob Iaccino. Bob Iaccino is compensated by TradeZero for participating in the Content. Mr. Iaccino's trading experiences and accomplishments are unique, and your trading results may vary substantially from his. TradeZero is not responsible for and neither affirms nor endorses any of Mr. Iaccino's views or opinions expressed in the Content. TradeZero makes no representations or warranties with respect to the accuracy of the Content or information available through any referenced or linked third party sites. The Content has been made available for informational and educational purposes only and should not be considered trading or investment advice or a recommendation as to any security. Nothing in this Content constitutes a personalized investment recommendation. Any securities discussed are referenced solely for illustrative and educational purposes.
Trading securities can involve high risk and potential loss of funds. Furthermore, trading on margin is for experienced investors and traders. Margin trading can result in losses that may be greater than your initial investment. Likewise, short selling as a securities trading strategy is extremely risky and can lead to potentially unlimited losses.
Options trading is not suitable for all investors as it can involve risk that may expose investors to significant losses. Please read the Characteristics and Risks of Standardized Options, also known as the options disclosure document (ODD) at OCC before deciding to engage in options trading.
TradeZero provides self-directed brokerage accounts to customers through its operating affiliates: TradeZero America, Inc. a United States broker dealer, registered with the Securities and Exchange Commission (SEC) and member of the Financial Industry Regulatory Authority (FINRA) and the Securities Investor Protection Corporation (SIPC); TradeZero, Inc., a Bahamian broker dealer, registered with the Securities Commission of the Bahamas; and TradeZero Canada Securities ULC, a Canadian broker dealer, member firm of the Canadian Investment Regulatory Organization (CIRO) and member of the Canadian Investor Protection Fund (CIPF); and TradeZero Europe B.V., a Dutch broker dealer, authorized and regulated by the Netherlands Authority for the Financial Markets (AFM) and subject to the regulatory framework of the European Securities and Markets Authority (ESMA) under MiFID II (collectively, the "TradeZero Broker Dealers").
Related Articles
Trading Strategies