How to Read a Level 2 Quote: Market Depth, Ax Identification, and Order Flow Signals
October 21, 2026

A Level 2 quote shows the order book behind the price: multiple levels of bids and asks, the size displayed at each level, and the market maker or venue identifiers (MMIDs) behind them — where a Level 1 quote shows only the best bid and ask. Read well, Level 2 can reveal detailed information around where liquidity for a specific stock actually sits, which price levels matter, and who’sproviding the market.
To the uninformed eye, it’s a wall of flickering numbers — and occasionally a stage for orders designed to mislead. Here’s how traders read it.
Key takeaways
- Level 2 shows depth — multiple price levels, sizes, and participant IDs — where Level 1 shows only the best bid and ask.
- The book shows intention (resting limit orders); time and sales shows action (completed trades). Reading them together is what tape reading actually is.
- The “ax” is the dominant liquidity provider in a name at a given time — identifiable by persistent size at the inside quote, but a shifting title, not a fixed one.
- The “market maker signal codes” that circulate in trading forums (100, 300, 911, and so on) have no credible basis — displayed size is not a secret language.
- TradeZero provides Level 2 market data on its ZeroPro and TZ1 platforms, paired with customizable hot keys for acting on what the book shows.
What Are Level 2 Quotes?
A Level 2 quote is a view into an exchange’s order book. Beyond the best bid and best ask (the Level 1 view), it displays multiple price levels on both sides, the share size resting at each level, and the ID of the market maker( MMID ) or venue posting it. The practical upgrade is context: Level 1 tells you the price; Level 2 tells you what’s behind the price.
MMID stands for Market Maker Identifier (sometimes called Market Participant ID). It's a short code, usually four letters, that tells you which firm or trading venue is posting the bid or offer at a given price level.
On a Level 2 screen you might see one row reading something like
"NSDQ 100.05 x 500"
and another reading
"ARCA 100.04 x 1,200."
In those rows NSDQ and ARCA are the MMIDs, telling you the quotes come from Nasdaq's own book and NYSE Arca. Individual broker-dealers acting as market makers have their own codes too. Familiar examples include GSCO for Goldman Sachs, MSCO for Morgan Stanley, and CDRG for Citadel Securities. The codes are assigned through FINRA/Nasdaq.
How do Level 1 and Level 2 compare?
| Level 1: | Level 2: | |
| Prices shown | Best bid and best ask only | Multiple bid and ask price levels (typically 5–10+ deep) |
| Sizes shown | Size at the inside quote | Size at every displayed level |
| Participants | Not shown | Market maker / venue identifiers (MMIDs) at each level |
| What it answers | What’s the price right now? | Where is the liquidity, and who’s providing it? |
Understanding Market Depth and the Level 2 Order Book
Market depth is the market’s capacity to absorb orders without significant price movement — and the order book is where it’s visible.
A stock with heavy size stacked through its levels can take large orders in stride; a thin book means even modest orders move the price. Depth is related to volume and liquidity but isn’t identical to either: it’s specifically about what’s resting on the book right now, at which prices, in what size.
Bid and ask size interpretation
Two practical reads dominate. First, support and resistance: large size clustered near a price level can function as a floor (bids) or ceiling (asks) — not a guarantee, but trade-relevant information about where other participants have committed intention.
Level 2 alone doesn’t confirm a support or resistance line, but it shows where one might live. Second, supply and demand: because the book displays the top levels and their sizes, a trader can see where liquidity actually concentrates. If a stock trades at $1.00 but the book shows most bid liquidity resting at $0.97, that’s context for order placement — a buy limit near the liquidity rather than at the last print.
Liquidity and order book imbalances
Liquidity is a door: high liquidity swings open — positions entered and exited freely — while low liquidity is a heavy door, and sometimes a locked one. A trader needing to exit 1,000 shares into a book showing 50 shares of bid size near their price isn’t exiting; they’re negotiating, level by level, at worsening prices. Reading depth before entering is how that scenario gets caught in advance.
Order book imbalance is the summary statistic: a large disparity between total displayed bid size and total displayed ask size. A heavily bid-weighted book can precede upward pressure, and the reverse for asks — with the standing caveat that displayed orders are intentions, revocable at any moment, which is exactly why the next section exists.
Observation on the book / Possible read / The caveat
| Observation on the book: | Possible read: | The caveat: |
| Large size stacked near one price | Potential support (bids) or resistance (asks) at that level | Displayed size can be pulled — it’s intention, not commitment |
| Order book imbalance (bids ≫ asks, or reverse) | Pressure may be building in the heavier direction | Imbalances shift constantly; confirm against the tape |
| Heavy volume printing, price barely moving | Absorption — someone is soaking up the flow at that level | Says a large participant is active, not which way price resolves |
| Small displayed size refilling repeatedly at one level | Possible iceberg — a large hidden order being worked | Hard to distinguish from routine algorithmic quoting |
How Order Flow Appears on Level 2
The order book is the future tense — orders that may execute. Order flow is the present tense — orders that did. The book shows what participants say they’ll do; the tape — the time and sales stream of completed trades — shows what they’reactually doing, and the gap between the two is where further insights can live.
Using time and sales with Level 2 data
On a trading platform, time and sales (T&S) is its own panel, usually docked right beside the Level 2 ladder: a scrolling list where every completed trade prints as a new row — time, price, and size — the instant it executes.
That scrolling list is “the tape” (from the days when it was literally a paper ticker tape), and reading the tape simply means watching it. Most platforms color-code each print — typically green for trades at the ask (buyers paying up) and red for trades at the bid (sellers hitting down) — so direction is visible at a glance. Combined with Level 2, it becomes the confirmation layer. Suppose the book shows a bid-heavy imbalance; a trader checks the tape and finds large buy prints — individual completed trades — hitting steadily, minute after minute. Book and tape now agree — resting intention and completed action pointing the same way — which is meaningfully stronger evidence than either alone. Level 2 is words; the tape is actions. Traders trust the combination precisely because actions are expensive to fake and words aren’t. (Tape review also has a natural home in the pre-market routine, where thin early prints get their context.)
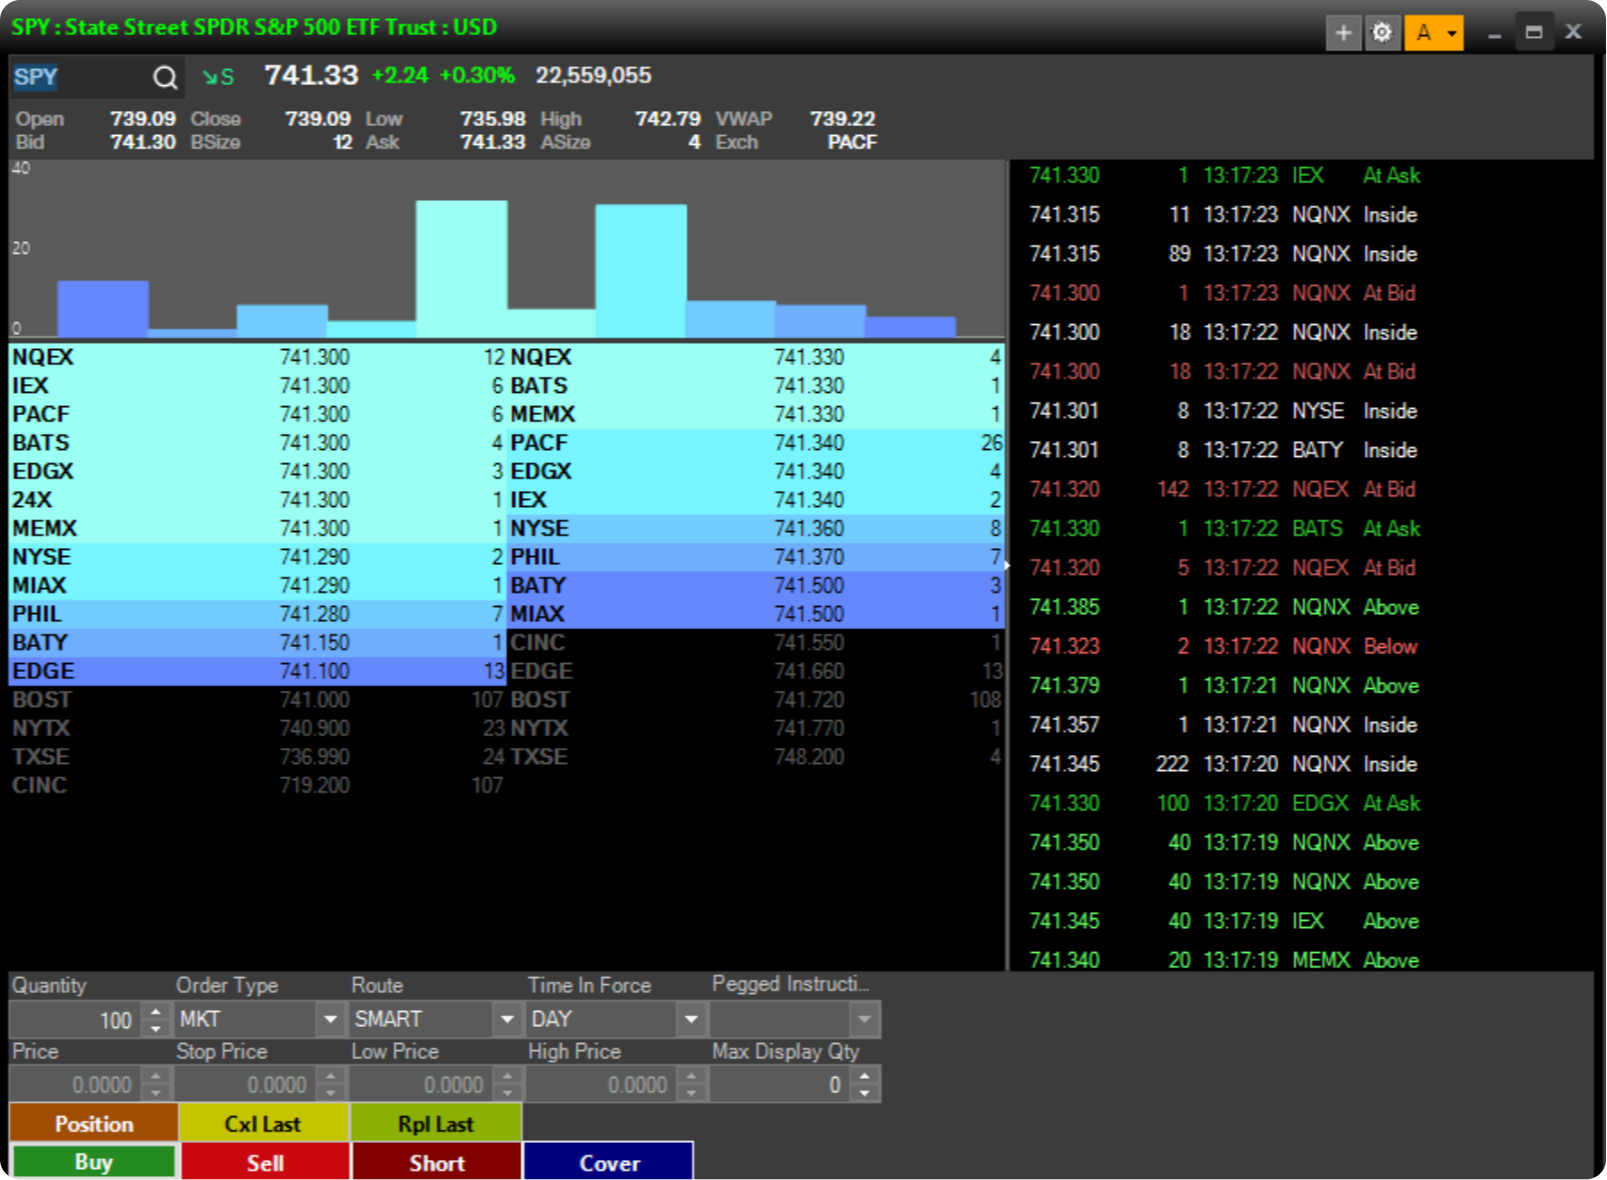
Level 2 Data Panel on ZeroPro
Spotting buying and selling pressure
Pressure shows up in the time and sales panel as a combination of size, frequency, and fill speed: large trades printing one after another, filling quickly, all in one direction. A classic example — sustained large buying continuing even as a stock presses into a known resistance level can precede a breakout attempt; the mirror image can precede a breakdown. Neither is a guarantee; both are the kind of early evidence tape readers are watching for. (Shorting-side pressure has its own measurable footprint — covered in our guide to short interest vs. short volume.)
What Is an Ax in Level 2 Trading?
The ax is the dominant liquidity provider in a particular stock at a particular time — the market maker whose size and persistence at the inside quote — the best bid and ask — make them the participant other traders watch. The role isn’tofficial and the title shifts: the ax in a stock this month may be absent from it next month. What distinguishes an ax is scale — their displayed orders and refresh patterns tend to dwarf other participants in that name.
Traders watch the ax because a participant of that size moves the best bid and ask simply by operating — where they post, pull, and refresh size is real information about where liquidity will be. Two honest caveats: identifying the ax takes sustained observation of MMID behavior across sessions, and no large participant benefits from being predictable — market makers earn primarily from spreads and rebates, and telegraphing their book to the market would cost them. Expect the picture to be deliberately noisy.
Market Maker Signals and Institutional Order Flow
The “signal code” myth
A persistent piece of trading-forum folklore holds that market makers signal each other through specific displayed order sizes — 100 shares meaning one thing, 300 another, 911 meaning pending news, and so on, a whole supposed dictionary. There is no credible evidence this is real. No regulator, exchange, or market-making firm has ever documented such a system; modern displayed size is overwhelmingly generated by algorithms managing inventory and quoting obligations, not by humans passing coded messages; and coordinated signaling of the kind the codes imply would raise serious legal problems for any firm actually doing it. Round-number order sizes appear constantly on every book because algorithms and retail traders alike use round numbers. Treating them as a secret language reads intent into noise — and trading on that reading is trading on nothing.
What institutional order flow actually looks like
The real version of “reading the big players” is less cinematic. Institutions moving large positions can’t transact all at once without moving the price against themselves, so they work orders over time — slicing them into chunks, often algorithmically, to minimize market impact. They aren’t hiding a conspiracy; they’re managing execution costs. The observable footprints, none of them conclusive alone:
- Block-sized prints on the tape. Unusually large completed trades, especially recurring ones, suggest a sizable participant working a position.
- Absorption. Heavy volume printing while price barely moves — suggest that someone is soaking up everything offered at that level. The tell is the volume/movement mismatch.
- Iceberg patterns. Small displayed size at a level that refills immediately every time it’s taken — this might suggest a large hidden order showing only its tip.
- Persistent one-sided pressure. Steady directional flow across hours or sessions, out of proportion to news — might suggest a position being built or unwound patiently.
- Institutional participants are not necessarily market makers, not always right, and never obligated to be detectable. The footprints above are evidence to weigh, not identities to unmask.
Common Mistakes When Reading L2 Quotes
- Treating Level 2 as a standalone indicator. The book is one input. Weighing it against volume, the tape, and price context is what catches spoofed depth and misread imbalances.
- Cluttering the screen. Level 2 plus time and sales adds real density to a layout. Traders who use it well streamline everything else — the book earns screen space by displacing something, not by piling on.
- Overtrading the flicker. The book updates continuously, and every update can look like a signal. Acting on flickers rather than confirmed reads turns Level 2 from an information edge into an impulse generator.
- Sizing errors in both directions. Committing too much to one position risks outsized damage from a single bad session; sizing so timidly that the strategy can’t function is its own failure mode. Position size should always reflect the risk/reward of the specific trade, including the realistic chance it ends in a loss — the full framework is in our guide to asymmetric risk and position sizing.
Where TradeZero Fits
Level 2 is a decision layer, and it works best living next to the execution layer. TradeZero provides Level 2 market data on its ZeroPro and TZ1 platforms — full order book depth for reading bid/ask pressure behind a setup — paired with customizable hot keys, so acting on what the book shows takes a keystroke rather than a mouse journey. For active traders comparing platforms, depth data of this kind at a low cost US broker is the practical test: the book only helps if you can afford to watch it all session and act on it instantly.
FAQ: Level 2 Quotes
What is a Level 2 quote?
A Level 2 quote is a display of an exchange’s order book showing multiple levels of bids and asks beyond the best price, the share size resting at each level, and the market maker or venue identifiers (MMIDs) posting them. Where a standard Level 1 quote answers “what is the price,” Level 2 answers “where is the liquidity and who is providing it,” which is why active traders use it to read depth, locate support and resistance, and judge pressure behind a move.
What is the difference between Level 1 and Level 2 quotes?
A Level 1 quote shows only the best bid and best askwith their sizes — the inside market. A Level 2 quote shows the full displayed order book: multiple price levels on both sides, the size at each level, and the participant identifiers behind the orders. The practical difference is depth of context: Level 1 is enough to know the current price, while Level 2 shows how much liquidity stands behind and beneath that price, which matters for sizing, order placement, and reading short-term pressure.
What is an ax in trading?
The ax is the dominant market maker or liquidity provider in a particular stock at a given time — the participant whose displayed size and persistence at the inside quote make them the one other tradersmonitor. The title is informal and shifts over time as participants rotate between names. Traders identifya likely ax by watching MMID behavior across sessions for consistent, outsized presence, though large participants have every incentive to make that identification difficult.
Are market maker signal codes real?
Market maker signal codes — the forum lists claiming that displayed sizes like 100, 300, or 911 are coded messages between market makers — are not supported by any credible evidence. No regulator, exchange, or market-making firm has ever documented such a system, and modern displayed size is generated overwhelmingly by algorithms managing inventory rather than by humans signaling. Round-number sizes appear constantly on every order book for mundane reasons, and building trades around a supposed secret meaning behind them means trading on noise.
Does TradeZero offer Level 2 market data?
TradeZero offers Level 2 market data on its ZeroPro and TZ1 platforms, giving traders full displayed order book depth — multiple bid and ask levels with sizes and participant identifiers — alongside time and sales for tape reading. The data pairs with customizable hot keys on the same platforms, so reading pressure on the book and acting on it happen in one workflow.
Disclosure
TradeZero America, Inc., a United States broker-dealer, is registered with the Securities and Exchange Commission (SEC) and is a member of the Financial Industry Regulatory Authority (FINRA) and the Securities Investor Protection Corporation (SIPC); TradeZero, Inc., a Bahamian broker-dealer, is registered with the Securities Commission of The Bahamas; TradeZero Canada Securities ULC, a Canadian broker-dealer, is a member firm of the Canadian Investment Regulatory Organization (CIRO) and the Canadian Investor Protection Fund (CIPF); and TradeZero Europe B.V., a Dutch broker dealer, authorized and regulated by the Dutch Authority for the Financial Markets (AFM). Collectively, these entities are referred to as the "TradeZero Broker-Dealers", and are subsidiaries of TradeZero Holding Corp.
TradeZero Broker-Dealers offer self-directed electronic securities trading services. They do not provide financial or trading advice, nor do they make investment recommendations. This communication does not constitute an offer to sell or a solicitation to buy any security or financial instrument mentioned.
There are risks associated with online securities trading, including equities and options. Trading on margin is intended for experienced investors only, as losses can exceed the initial investment.
Short selling is extremely risky and can potentially lead to unlimited losses.
If you have any specific questions about TradeZero America's brokerage services, please reach out to customer support.