Short Selling

What Is a Short Locate? How Stock Locates Work
A short locate is the process of confirming that shares of a stock are available to borrow before a short sale is placed.
When you short a stock, you're selling shares you don't currently own. Before your broker can accept the short sale, it must make a reasonable determination that those shares can be borrowed and delivered for settlement.

Short Interest vs Short Volume: What Traders Need to Know
Short interest measures how many shares of a stock are currently sold short and not yet covered — a snapshot of open positioning. Short volume counts how many shares were sold short during a period, usually a single day — a flow of activity.

Inverse Cup and Handle Pattern: How Traders Assess Bearish Structure and Sentiment Shifts
The Rounding Top is a classic Japanese candlestick chart pattern that is commonly interpreted as a potential bearish reversal pattern. It forms gradually over time at the end of a strong uptrend, and may reflect a shift from strong bullish momentum toward weakening sentiment, with its curved shape denoting how buyers gradually lose strength with each consecutive push higher, finally culminating in a potential market top.

Island Reversal Pattern: How Traders Interpret Gaps, Sentiment Shifts, and Potential Reversal Signals
The Island Reversal is a bearish reversal chart pattern distinguished by its sharp, visually distinct shape, with a gap up that is quickly followed by a gap down after a short consolidation period, or vice versa.

Rounding Top Pattern: How Traders Evaluate This Gradual Shift in Momentum
The Rounding Top is a classic Japanese candlestick chart pattern that is commonly interpreted as a potential bearish reversal pattern. It forms gradually over time at the end of a strong uptrend, and may reflect a shift from strong bullish momentum toward weakening sentiment, with its curved shape denoting how buyers gradually lose strength with each consecutive push higher, finally culminating in a potential market top.
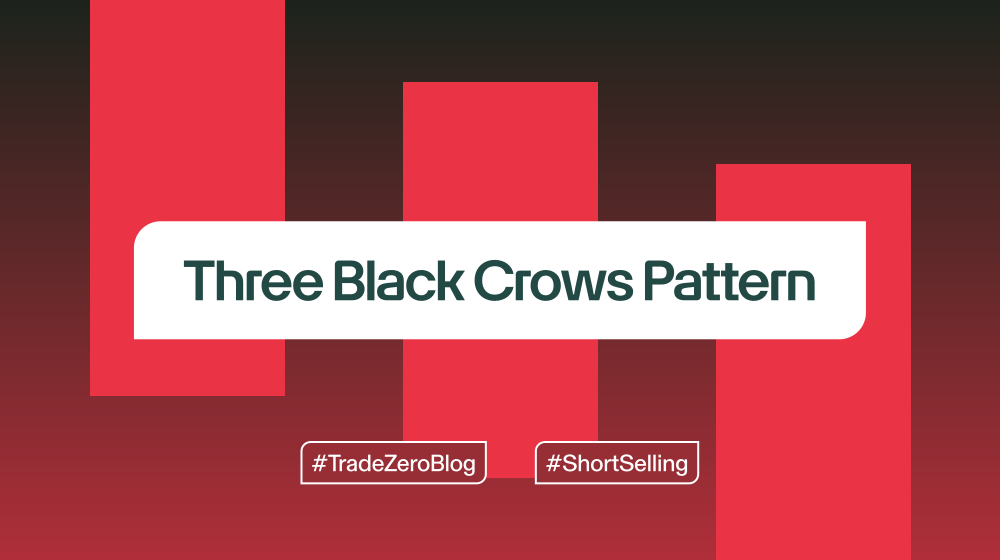
Three Black Crows Pattern: How Traders Assess Bearish Momentum
The Three Black Crows is one of the most widely recognizable bearish candlestick chart patterns. It is made up of three consecutive and long-bodied red handles, which are formed after an established downtrend.
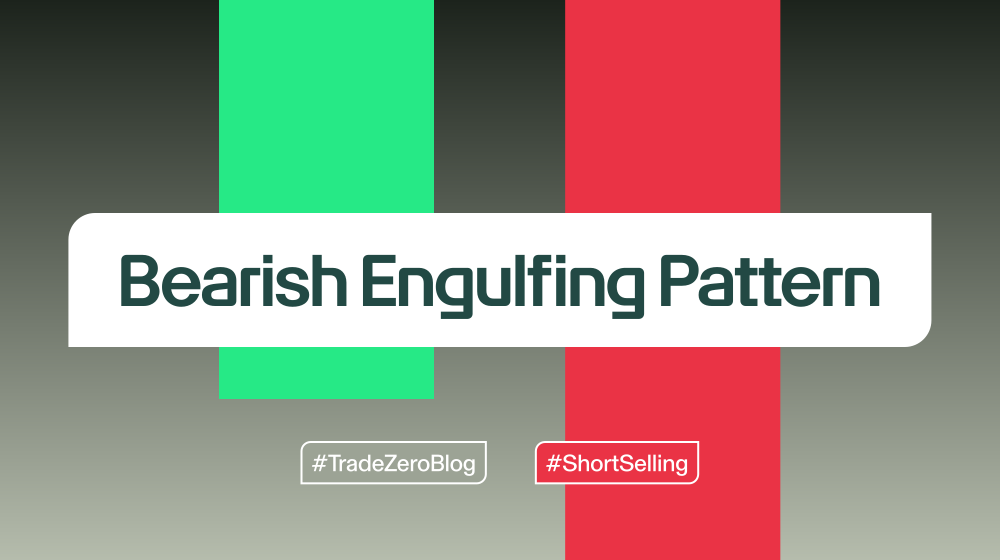
Bearish Engulfing Pattern: How Short Sellers Spot and Trade Momentum Reversals
See how the bearish engulfing pattern signals reversals and how TradeZero helps short sellers enter precisely and manage risk.
Parabolic SAR Indicator: How Traders Use It to Spot Turns and Control Risk
Learn how the Parabolic SAR helps traders spot reversals, trail stops, and stay disciplined in fast-moving markets with TradeZero.

The Dead Cat Bounce: A Short Seller’s Guide to Fading Strength
Learn how to identify dead cat bounces and how TradeZero equips short sellers to fade false
rallies with speed, precision, and risk control.

Triple Top Pattern: How Short Sellers Use This Bearish Signal to Capitalize on Fading Momentum
See how triple top patterns signal failed breakouts—and how TradeZero helps short sellers capitalize with precision in fast-moving markets.