Island Reversal Pattern: How Traders Interpret Gaps, Sentiment Shifts, and Potential Reversal Signals
May 28, 2026

By Shane Neagle
The Island Reversal is a bearish reversal chart pattern distinguished by its sharp, visually distinct shape, with a gap up that is quickly followed by a gap down after a short consolidation period, or vice versa.
This sequence of events results in a visual structure that may indicate a shift in market sentiment, weakening momentum, and a potential reversal, whereby buyers may find themselves on the wrong side of the “island” as prices move aggressively toward the downside. This, in turn, can exacerbate selling, as buyers who have mistimed their trades opt to lock in smaller losses after reassessing risk.
Short sellers often monitor Island Reversals because they may appear near exhaustion points in overextended, news-driven, or small cap stocks, where enthusiasm can fade quickly, which some traders view as potentially setting up downside-biased scenarios.
These fast, gap-driven moves also make the pattern a common reference point in day trading, where traders react to shifts as the session unfolds
When used within a broader technical analysis framework, the Island Reversal can serve as one of several patterns traders reference. However, effectively using the pattern requires a clear understanding of what it represents, how to trade it, and the underlying market psychology.
What is an Island Reversal Pattern?
Let’s begin with the Island Reversal’s structure. The pattern forms when price gaps sharply in one direction, then consolidates for a brief time, before another gap, this time in the opposite direction of the first, occurs. This isolates the consolidation area visually, or, in other words, forms an “island” of price action that is separated on both sides by the aforementioned gaps.
This isolated segment reflects moments in which market participants see a shift in expectations. That shift can occur due to a variety of reasons, including but not limited to news events, a surge in speculative enthusiasm, or reactions to short-term catalysts. Once the second gap forms, many traders interpret it as a shift in expectations and a potential change in trend.
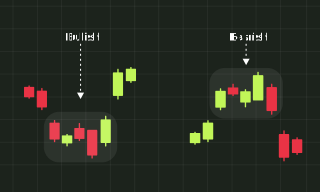
An important thing to note is that, unlike most chart patterns, the Island Reversal can occur in both uptrends and downtrends. However, the signal is generally considered more meaningful when it appears after a strong uptrend and hints at a bearish reversal. Since this is both the most common and most meaningful form of the pattern, we will focus solely on this variation, the one relevant to short selling, in this article.
With that being the case, the version of the pattern we’ll be focusing on occurs after a strong upward move, and may reflect a rapid shift in conviction.
Psychology Behind the Island Reversal Pattern
Now, before moving on to the methods by which you can identify, confirm, and trade the Island Reversal, let’s take a moment to discuss the market psychology that underpins that pattern, as it can help short sellers better understand the wider context in which the pattern appears.
We begin with an initial gap up on the chart that is a clear sign of aggressive bullish enthusiasm. This upward move is often caused by news, hype, speculative surges, positive catalysts, or an upswing in enthusiasm. Since the move can be explosive and significant, it often may create a sense of urgency among some traders, who may feel pressure to get in on the action before such a move continues.
However, after the initial gap up, prices tend to stabilize. Price action then settles into a consolidation period, excitement levels off, and the underlying buying pressure weakens. At this point, some of the traders who entered early may choose to take profits, volume might weaken, and the strength of upward moves loses consistency. The key factor is that, at this point, the underlying conviction is no longer increasing, and bullish enthusiasm isn’t accelerating.
After this, a sudden gap down occurs. This is the moment in which the decisive psychological shift happens. Buyers who entered late are now suddenly trapped in unfavorable positions, and are made keenly aware of that fact immediately at the opening of the trading session. By now, the earlier enthusiasm has weakened and reversed, and forced exits and elevated selling pressure may reinforce bearish sentiment.
For traders interested in short selling, the second gap is the point of interest. Since sentiment reverses sharply and often leads to accelerated downward momentum, traders may seek to participate in downward price movement. We’ll get into how to trade the pattern in a minute, but first, let’s deal with the topic of due diligence.
How to Identify and Confirm an Island Reversal Setup
Before you open a short position, you should confirm the validity of the Island Reversal Setup. To do so, the first step is being able to precisely and reliably identify it. The sequence of price behavior and the conditions that surround each stage of the pattern are elements that you should pay close attention to.
For starters, we should have a clear gap up: in simple terms, a session opens visibly above the last close, with plenty of empty space between the two. This initial jump sometimes resembles a breakaway gap, where price separates sharply from prior trading activity and signals a potential shift in conviction.
Following this, there should be a defined consolidation period, otherwise known as the “island”. This range doesn’t necessarily have to last for long, but it should typically be distinct enough to be interpreted as a contained cluster of trading activity. In addition, during this period, price action should ideally be stable, without significant attempts by the bulls to continue the earlier upward move.
After the “island”, we have a gap in the opposite direction from the first gap. Since we’re discussing the bearish reversal version of the pattern, this is a clear gap down. Just like in the case of the first gap, the new session’s open should be significantly below the prior session’s close, with a clearly visible amount of empty space between.
Because Island Reversals often form in low-float, news-driven names, the shares can be difficult to borrow — so confirming locate availability before the open is part of preparing the trade.
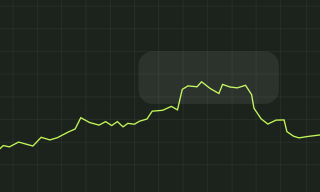
That’s it for identification, but what about confirmation? For starters, traders often consider trading volume as part of confirmation. Typically, both gaps in the Island Reversal happen on stronger volume, while the “Island” or brief consolidation phase sees decreased volume. These increases in volume are often viewed as supportive of the pattern and may indicate shifts in participation.
In addition, traders should look for a breakdown below the gap-down candle’s low, as well as increased selling volume after the second gap occurs. On top of this, rejection at prior resistance levels or exhaustion-level highs also may lend additional support to the signal.
How to Trade the Island Reversal Pattern
Once traders believe an Island Reversal chart pattern has formed, they may consider whether to open a position based on their broader strategy. To refine execution, traders often pay attention to several factors, you’ll need to pay close attention to several factors. Luckily, there’s a simple, intuitive framework for how to trade the Island Reversal pattern.
In terms of entries, most traders opt to open a position either on the second gap (the gap down), or at the breakdown below the consolidation low when short selling. Both of these approaches are often viewed as more conservative of the spectrum; however, more aggressive traders sometimes enter positions on the first sign of reversal, provided that trading volume is strong.
Using stop-loss orders is a common risk management practice. One common method is to place a stop above the high of the consolidation “island”, although more conservative or risk-averse traders sometimes place stops just above the gap-down candle. Both of these
placements are designed so that the stop activates if downward momentum fails to continue, while still leaving a degree of space for intraday volatility to play out.
When evaluating potential price targets, traders may reference previous support zones, gap-fill regions, or make use of measured-move targets that use the height of the “island” as a reference point.
Traders working setups like this often cycle through several entries, exits, and stop adjustments, so the cost per order is worth weighing alongside the setup itself. TradeZero low cost brokerage model can help you keep costs to a minimum.
Common Mistakes and How to Avoid Them
The Island Reversal pattern offers plenty of advantages. However, traders might still run into issues if they misunderstand the pattern’s structure, misjudge the context in which it appears, or make one of several common mistakes. Let’s take a look at the most frequent pitfalls when using this pattern.
For starters, misidentification is a potential issue. The consolidation period that forms the “island” must be clearly isolated by two clear gaps. These gaps have to be distinct and separated from the surrounding price action, with no candles blending.
Next up are early entries. During extended moves, enthusiasm can change, shift, fade in, or fade out in unexpected ways. While it might seem tempting to open a short position before the pattern is confirmed, this approach increases the likelihood of entering into a false setup.
Another common error is ignoring broader market conditions. If there is a strongly bullish market-wide sentiment, it might invalidate and override the reversal. Evaluating the broader environment helps traders judge how resilient a reversal may be.
Volume is often considered an important factor when evaluating the strength of a potential reversal, so traders should always keep an eye on it. As we mentioned earlier, gaps that occur on weak volume may suggest that the pattern lacks a strong participation pattern.
Lastly, traders should remember to take into account liquidity conditions. Thinly traded stocks sometimes experience gaps that may not reflect broader sentiment, so this is yet another avenue where false or low-conviction setups can occur.
Conclusion
The Island Reversal pattern’s two-gap structure provides a clear framework for evaluating moments in which sentiment could potentially be shifting and when buyers may be losing momentum after an extended move.
Chart patterns are useful tools, but using them effectively requires familiarity with confirmation and a careful analysis of the wider context. With that being said, the Island Reversal may serve as a useful component within a broader technical analysis process to a broader technical process.
Disclaimer
This content (“Content”) is produced by Tokenist Media LLC. The Content represents only the views and opinions of Tokenist Media LLC.Tokenist Media LLC’s trading experiences and accomplishments are unique, and your trading results may vary substantially. Tokenist Media LLC is a paid marketing partner of TradeZero that receives compensation from TradeZero for broadcasting, displaying, and/or presenting marketing and sponsorship materials that promote TradeZero. TradeZero does not endorse the Content and makes no representations or warranties with respect to the accuracy of the Content or information available through any referenced or linked third party sites. The Content has been made available for informational and educational purposes only and should not be considered trading or investment advice or a recommendation as to any security.
Trading securities can involve high risk and potential loss of funds. Furthermore, trading on margin is for experienced investors and traders only as the amount you may lose can be greater than your initial investment. Likewise, short selling as a securities trading strategy is extremely risky and can lead to potentially unlimited losses.
Options trading is not suitable for all investors as it can involve risk that may expose investors to significant losses. Please read the Characteristics and Risk of Standardized Options, also known as the options disclosure document (ODD) at https://www.theocc.com/Company-Information/Documents-and-Archives/Options-Disclosure-Document before deciding to engage in options trading. Please also see the Options Trading Disclosure. You must be approved to trade multi-leg options strategies. You may lose all of your principal. Executing multi-leg options orders may result in increased transaction fees compared to single-leg options orders. Multi-leg strategies may exhibit risks such as illiquidity and increased sensitivity to market unpredictability.
TradeZero provides self-directed brokerage accounts to customers through its operating affiliates: TradeZero America, Inc., a United States broker dealer, registered with the Securities and Exchange Commission (SEC) and member of the Financial Industry Regulatory Authority (FINRA) and the Securities Investor Protection Corporation (SIPC); TradeZero, Inc., a Bahamian broker dealer, registered with the Securities Commission of the Bahamas;TradeZero Canada Securities ULC, a Canadian broker dealer, member firm of the Canadian Industry Regulatory Organization (CIRO) and member of the Canadian Investor Protection Fund (CIPF) and TradeZero Europe B.V., a Dutch broker dealer, authorized and regulated by the Dutch Authority for the Financial Markets (AFM) (collectively, the “TradeZero Broker Dealers”).