Trading Pullbacks With the 8 and 21 EMAs
November 12, 2026

Trading Strategies with Bob Iaccino
*Bob Iaccino, Chief Market Strategist and Co-Founder of Path Trading Partners, as our risk management educator. With 30 years' experience working as an active investor in equities, commodities, futures and FX, Bob brings extensive practical experience to the subject of risk management.
Key Points at a Glance
- A touch of the 8 or the 21 EMA is not an entry. Price needs to spend time in the rotation zone first, preferably two to four candles.
- The entry signal is a break above a downward-sloping trendline drawn along the pullback's swing highs, as price moves out of the zone.
- The stop goes below the 21 EMA, beyond the support area. If that support fails, the reason for the trade is gone.
- Check higher time frames first: a five-minute long running into an hourly rotation zone faces potential resistance.
- When the 8 and 21 flatten and converge, the trend is weakening and the zone no longer counts.
- This article covers longs in an uptrend. Shorts in a downtrend follow the same process, reversed.
From Rotation Zone to Entry: When To Buy the Pullback?
In the last article, we covered how a rotation zone forms. The 8-period exponential moving average, or EMA, crosses above the 21-period EMA for long trades or below for short trades. Both averages then slope in the direction of the respective trade and separate. Once that zone is established in a strong intraday uptrend, we can start looking for pullbacks into that newly created zone. The next question is when to enter.
For this article, I’m focusing only on long trades in an uptrend. The same process applies to short trades in a downtrend, with everything reversed.
Why a Touch of the 8 or 21 Is Not Enough
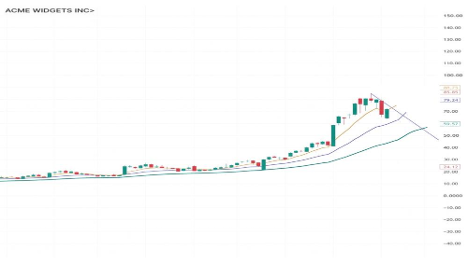
Simply buying when price touches the 8 or the 21 leaves out an important part of the process. I want to see price spend some time in the rotation zone, then show signs that the pullback is ending by “rotating” higher. To do that, I draw a downward-sloping trendline along the pullback and wait for price to break above it as it moves out of the zone.
Where I expect support
In a strong intraday uptrend, the area between the rising 8 and 21 is potential support. Sometimes the pullback holds near the 8 and never reaches the 21. Other times it moves deeper into the zone. Either can work, as long as the trend remains intact, and we get the entry signal.
What a Move Below the 21 EMA Means
A brief move below the 21 does not necessarily mean support has failed. But if price closes below it and cannot get back above it, I would expect more downside. If a trade develops, the stop often gets placed below the 21, beyond the area we are relying on for support. The averages help define support and risk, but a touch of either average is not enough. I still need confirmation that support is holding before treating the pullback as complete.
Price Movement
| What price does in the zone | How Bob reads it |
| Holds near the 8 and never reaches the 21 | Can work, as long as the trend remains intact and the entry signal arrives |
| Moves deeper into the zone | Can work, same conditions |
| Brief move below the 21 | Does not necessarily mean support has failed |
| Closes below the 21 and cannot get back above it | Expect more downside |
Give the pullback time to develop
Once price enters the rotation zone, I prefer to see it spend two to four candles there. A single candle can touch the zone and immediately reverse or move straight through it. That does not give me the same opportunity to see whether support is holding.
Why the Candle Count Is a Guide, Not a Rule
The point is not to get caught up in an exact candle count. I want to see price spend time between the averages without breaking down and without the rotation zone flattening out too much. If price drops through the entire zone in one candle, or never settles between the averages, it doesn’t give me enough time to evaluate the setup I’m looking for.
Wait for the trendline break
The buy comes when price breaks above that downward-sloping trendline (preferably closing above it, depending on the time frame you’re looking at) as it moves out of the rotation zone. That signals the pullback may be ending and the larger uptrend may be resuming. Until that happens, I am watching. If the trendline never breaks, there is no entry.
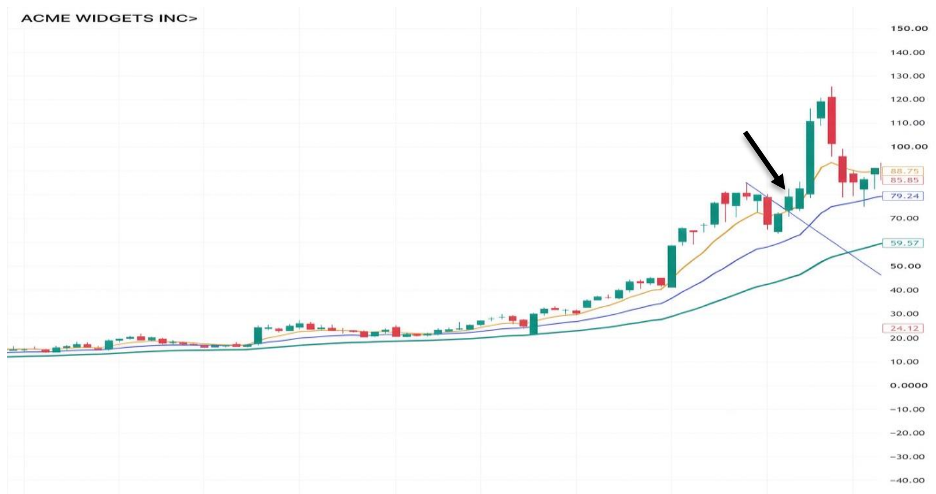
The arrow in the image represents the long-trade entry point.
Putting the trade together
Here is the sequence I look for in a strong intraday uptrend.
- Confirm that a rotation zone has developed. The 8 must be above the 21, with both averages rising and separating.
- Check the higher time frames. A long on a five-minute chart that runs directly into an hourly rotation zone overhead faces potential resistance. That changes the trade.
- Wait for price to pull back into the zone, preferably spending two to four candles between the averages.
- Draw the downward-sloping trendline along the swing highs of that pullback.
- Look to buy the break above that line as price moves out of the zone.
- Place the stop below the 21 EMA (minding other support levels) beyond the support area. If that support fails, the reason for holding a long trade is gone.
The Rotation Zone Long Entry at a Glance
| Step | What to look for | Why it matters |
| 1. Rotation zone | 8 above the 21, both rising and separating | No zone, no setup |
| 2. Higher time frames | No hourly rotation zone sitting overhead | Overhead zone is potential resistance and changes the trade |
| 3. Pullback | Price in the zone for two to four candles | Time to see whether support is holding |
| 4. Trendline | Downward-sloping line along the pullback's swing highs | Defines the entry trigger |
| 5. Entry | Break above the trendline as price leaves the zone | Signals the pullback may be ending and the uptrend resuming |
| 6. Stop | Below the 21 EMA, beyond the support area | If support fails, the reason for the trade is gone |
Recognize when the trend is weakening
Repeated pullbacks that hold inside the zone can support further moves higher, as long as the averages continue rising and remain separated. When the 8 and 21 flatten and move closer together, the trend is weakening, and the moving averages no longer represent a rotation zone. Spending two to four candles in that zone does not make it the same setup.
Why Bob Would Rather Miss the Last Move
| A valid rotation zone | A weakening trend |
| 8 above the 21 | 8 and 21 flattening |
| Both averages rising | Averages moving closer together |
| Averages separated | Zone no longer represents a rotation zone |
| Repeated pullbacks inside the zone can support further moves higher | Two to four candles in the zone is not the same setup |
I would rather miss the last move higher than buy a trendline break after the zone underneath it has flattened. The goal is to enter after a pullback shows signs of ending, while the larger trend still supports the trade.
Pullback Entry Do's and Don'ts
| Do | Don't |
| Let price spend time in the zone before acting | Buy simply because price touched the 8 or the 21 |
| Draw the trendline along the pullback's swing highs and wait for the break | Enter before the trendline breaks |
| Place the stop below the 21, beyond the support area | Hold a long after the support it relied on has failed |
| Check for a higher time frame rotation zone overhead | Buy a trendline break after the zone underneath has flattened |
Frequently Asked Questions About Trading Rotation Zone Pullbacks
When do you enter a rotation zone pullback trade?
Not when price touches the 8 or the 21. Bob wants price to spend time in the rotation zone, then show the pullback is ending by rotating higher. He draws a downward-sloping trendline along the pullback and looks to buy when price breaks above it as it moves out of the zone, preferably on a close above it.
Why isn't a touch of the moving average enough to buy?
Because a touch tells you nothing about whether support is holding. A single candle can touch the zone and reverse immediately, or go straight through it. Bob still needs confirmation that support is holding before he treats the pullback as complete.
How long should price stay in the rotation zone before entering?
Bob prefers two to four candles between the averages, but he says not to get caught up in an exact count. The point is that price spends time in the zone without breaking down and without the zone flattening out too much.
How do you draw the pullback trendline?
Draw a downward-sloping trendline along the swing highs of the pullback. The entry comes when price breaks above that line as it moves out of the rotation zone. If the trendline never breaks, there is no entry.
Where does the stop go on a rotation zone trade?
Below the 21 EMA, beyond the area being relied on for support, while minding other support levels. If that support fails, the reason for holding a long trade is gone. For day trading on short time frames, that stop sits close to the entry, which is part of why Bob waits for the trendline break rather than buying the first touch.
Does a dip below the 21 EMA mean the setup has failed?
Not necessarily. A brief move below the 21 doesn't mean support has failed. But if price closes below it and cannot get back above it, Bob would expect more downside.
Does the pullback need to reach the 21 EMA?
No. Sometimes the pullback holds near the 8 and never reaches the 21; other times it moves deeper into the zone. Either can work, as long as the trend remains intact and the entry signal arrives.
Should the entry be on a close above the trendline or an intrabar break?
Bob prefers a close above the trendline, depending on the time frame you are looking at. On faster charts the difference between a close and an intrabar break is smaller, but the principle is the same: wait for price to actually move out of the zone.
Why check the higher time frames first?
Because a long on a five-minute chart that runs directly into an hourly rotation zone overhead faces potential resistance. That changes the trade. Confirming the higher time frames before entering is step two of Bob's sequence.
Can this setup work for short trades?
This article focuses on long trades in an uptrend, but the same process can apply to short trades in a downtrend with everything reversed: the 8 crosses below the 21, both averages slope down and separate, price rallies into the zone, and the entry is a break below an upward-sloping trendline. For traders using short selling, the stop sits above the 21 rather than below it.
How do you know when the trend is weakening?
When the 8 and 21 flatten and move closer together. At that point the moving averages no longer represent a rotation zone, and spending two to four candles in that area does not make it the same setup.
Can you take repeated pullbacks in the same trend?
Repeated pullbacks that hold inside the zone can support further moves higher, as long as the averages continue rising and remain separated. Bob would rather miss the last move higher than buy a trendline break after the zone underneath it has flattened.
How do I find stocks in a strong intraday uptrend?
The setup needs a rotation zone first: the 8 above the 21 with both rising and separating. A stock scanner filtered for stocks trading above a rising 8 and 21 EMA on your time frame narrows the field to charts where a pullback entry could actually develop.
What is the full sequence for a rotation zone long trade?
Confirm the rotation zone has developed; check the higher time frames; wait for price to pull back into the zone, preferably for two to four candles; draw the downward-sloping trendline along the swing highs; buy the break above that line as price moves out of the zone; and place the stop below the 21 EMA beyond the support area.
Is the rotation zone always support?
No. In a strong intraday uptrend the area between the rising 8 and 21 is potential support, but the averages define support and risk; they do not guarantee it. That is why Bob waits for confirmation that support is holding.
Does this strategy suit frequent intraday trading?
It is built for a strong intraday uptrend and can produce several pullback entries in a session, though many pullbacks never give the trendline break. A day trader taking multiple small rotations in a day is relying on the trend staying intact between entries, which is why Bob watches for the averages flattening.
Do trading costs matter with this setup?
Yes, because the entries are small rotations rather than one large move, and several may be taken in a single session. Commissions and fees take a bigger share of a small gain than a large one, so a low-cost brokerage matters more here than it would for a single swing position.
Related Reading From This Series
Disclosure
This Blog (hereafter referred to as the "Content") is produced by TradeZero. The Content may include the views and opinions of TradeZero and a third-party participant, Bob Iaccino. Bob Iaccino is compensated by TradeZero for participating in the Content. Mr. Iaccino's trading experiences and accomplishments are unique, and your trading results may vary substantially from his. TradeZero is not responsible for and neither affirms nor endorses any of Mr. Iaccino's views or opinions expressed in the Content. TradeZero makes no representations or warranties with respect to the accuracy of the Content or information available through any referenced or linked third party sites. The Content has been made available for informational and educational purposes only and should not be considered trading or investment advice or a recommendation as to any security. Nothing in this Content constitutes a personalized investment recommendation. Any securities discussed are referenced solely for illustrative and educational purposes.
Trading securities can involve high risk and potential loss of funds. Furthermore, trading on margin is for experienced investors and traders. Margin trading can result in losses that may be greater than your initial investment. Likewise, short selling as a securities trading strategy is extremely risky and can lead to potentially unlimited losses.
Options trading is not suitable for all investors as it can involve risk that may expose investors to significant losses. Please read the Characteristics and Risks of Standardized Options, also known as the options disclosure document (ODD) at OCC before deciding to engage in options trading.
TradeZero provides self-directed brokerage accounts to customers through its operating affiliates: TradeZero America, Inc. a United States broker dealer, registered with the Securities and Exchange Commission (SEC) and member of the Financial Industry Regulatory Authority (FINRA) and the Securities Investor Protection Corporation (SIPC); TradeZero, Inc., a Bahamian broker dealer, registered with the Securities Commission of the Bahamas; and TradeZero Canada Securities ULC, a Canadian broker dealer, member firm of the Canadian Investment Regulatory Organization (CIRO) and member of the Canadian Investor Protection Fund (CIPF); and TradeZero Europe B.V., a Dutch broker dealer, authorized and regulated by the Netherlands Authority for the Financial Markets (AFM) and subject to the regulatory framework of the European Securities and Markets Authority (ESMA) under MiFID II (collectively, the "TradeZero Broker Dealers").