Trading Strategies
Page 5 of 6
The January Effect and What It Means for 2025
As we close out the first month of the year, it’s worth reflecting on the January Effect and its potential implications for the markets in 2025. While the January Effect has evolved over the years, it remains a topic of interest for traders and investors who want to better understand seasonal market trends and their possible predictive value.
Pre-Market Prep: Insights from Bob Iaccino
Every morning, my routine begins with analyzing U.S. Treasury yields. Interest rates play a crucial role in shaping stock market movements, and I track daily, weekly, and monthly changes using my custom spreadsheet.
Scanning And Charting
Today, we’re diving into an essential topic for those interested in short selling: scanning and charting. In this blog, I’m sharing my go-to techniques to help identify high-probability short trade setups.

Mastering Technical Analysis With Tradezero: Tools And Strategies For Savvy Traders
Technical analysis is one of the two primary methods to understand stock market movements. While fundamental analysis focuses on a company’s financial health for long-term growth, technical analysis zeroes in on price action.

Optimizing Trading Strategies With TradeZero: Understanding Order Types And Their Applications
Unlike traditional investing, which, while still risky, allows you to sit and observe whether your thesis is correct, trading requires rapid responses, and opportunities arise quickly — but also fade quickly.
Fibonacci Retracement
The Fibonacci sequence might seem like just a set of numbers at first, but its importance in trading lies in its ability to help identify potential levels of support and resistance. These are key levels where a stock or asset might pause or reverse during its price movement. Traders use Fibonacci retracement levels to gauge how much a price has pulled back from a previous trend, and they look for price action to either bounce or continue at these levels.
Measured Moves And Exits
Simply put, a measured move is a method where you measure areas of price action to predict the next move. They're very reliable because what you see on your chart represents two things: mob mentality and math. That's all it is.
The 10 Most Dangerous Things People Say About Stocks: A Trader’s Reality Check
I want to dive into something that's really important for all retail traders out there. It’s Peter Lynch’s list of the “10 Most Dangerous Things People Say About Stocks.” You might’ve heard it referred to as the “10 Dumbest Things,” but Lynch’s team thought that sounded too harsh. Regardless, these insights are crucial for avoiding common pitfalls in trading.
How To Trade Wedges
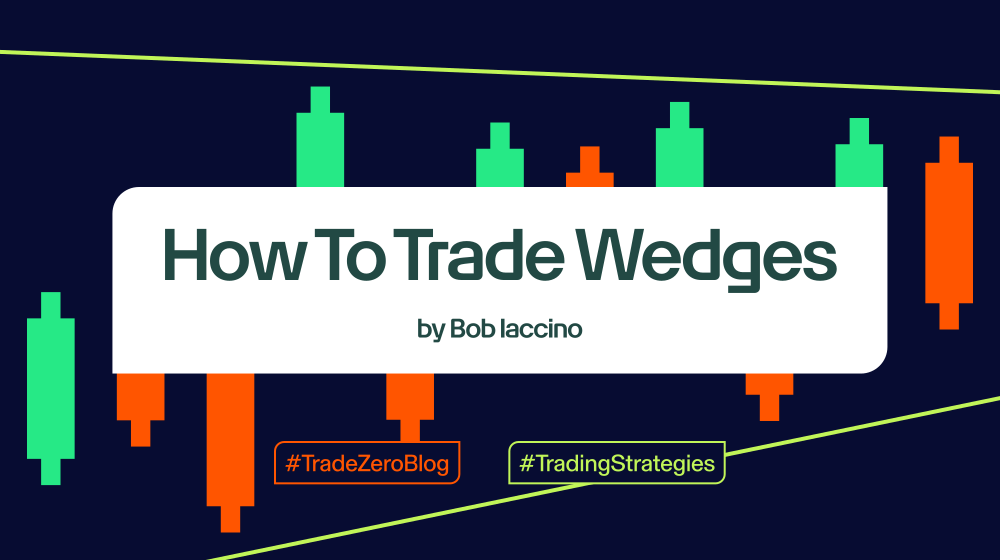
I use wedges all the time. Wedges are basically channels – that's the easiest way to put it. A wedge is a channel where the lower trendline is present, but within the upward-sloping or downward-sloping channel, there's also a second trendline...