Does this Rally have Underlying Support?
October 13, 2026

Market Recap
Analyzing the markets with Richie Naso, a Wall Street veteran of over 40 years and former member of the NYSE.
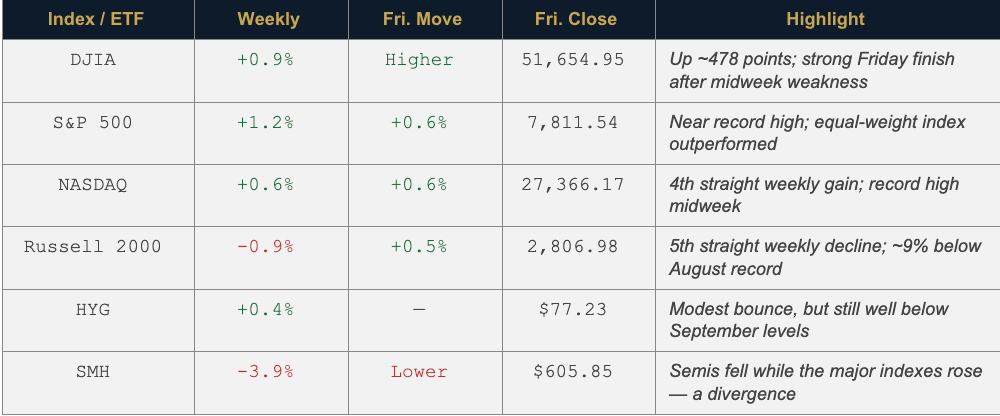
Market Close: Friday 9th October, 2026.
Last Week’s Main Indexes — Let’s Figure This Action Out
Dow Jones Industrial Average
The Dow finished the week up approximately 478 points, or 0.9%, closing Friday at 51,654.95. A strong finish on Friday helped the blue-chip index recover from midweek weakness and post a positive weekly result. (Source: AP News)
Richie’s take: The Dow’s positive weekly performance is encouraging, but the key question remains whether strength can broaden beyond the market’s leading technology names. Next week’s major bank earnings and inflation data should help determine whether this rally has the underlying support to continue.
S&P 500
The S&P 500 had a strong week, gaining 1.2% to close Friday at 7,811.54, finishing near its record high. The index advanced 0.6% on Friday alone, recovering from back-to-back declines earlier in the week. (Source: AP News)
One positive development was improving market breadth. The equal-weighted S&P 500 gained more than 1% for the week, outperforming the traditional cap-weighted index. That suggests participation may be expanding beyond the largest technology stocks—a development worth watching closely. (Source: MarketWatch)
Richie’s take: The S&P’s ability to remain near record territory is constructive, but I want to see broader participation confirm the move. Next week’s inflation data and major bank earnings could determine whether the rally gains further momentum. For now, the trend remains positive, but rising Treasury yields and uneven participation warrant continued caution.
Nasdaq
The Nasdaq Composite gained 0.6% for the week, closing Friday at 27,366.17—its fourth consecutive weekly advance. Despite some volatility, technology stocks rebounded Friday, lifting the index 0.6% on the session. The Nasdaq also reached a record high earlier in the week. (Source: MarketWatch)
Technology and AI-related shares continued to provide much of the market’s leadership. However, Thursday’s pullback in chip stocks highlighted investors’ growing sensitivity to AI valuations, future revenue expectations, and the substantial cost of financing AI infrastructure. (Source: Reuters)
Richie’s take: The Nasdaq’s continued strength is constructive, but after four consecutive weeks of gains, the market needs to demonstrate that momentum can be sustained. With Treasury yields elevated and earnings season approaching, technology stocks remain a key driver of the broader market. I would also watch the semiconductor sector closely and look for improving participation beyond the largest technology names. The rally remains intact, but confirmation from broader market breadth would make the advance more convincing.
SMH — Semiconductors
The VanEck Semiconductor ETF (SMH) had a volatile week, finishing at $605.85, down approximately 3.9% from the previous Friday’s $630.60 close. After advancing early in the week to $633.90 on Monday, the ETF reversed course, with selling pressure intensifying Thursday and Friday. (Source: Financial Times)
Semiconductors remain a critical driver of the broader market because of continued enthusiasm surrounding artificial intelligence and data-center investment. However, this week’s pullback suggests that even the strongest leadership groups are vulnerable to profit-taking after substantial gains.
Richie’s take: SMH deserves close attention. Its weakness contrasts with the S&P 500 and Nasdaq finishing the week higher, raising a question about the durability of technology leadership. I would watch whether semiconductor stocks stabilize and regain momentum. If SMH continues to deteriorate while the broader indexes advance, that divergence could become a warning sign for the rally. If it finds support and turns higher, it would strengthen the bullish case for technology leadership to continue.
Russell 2000
The Russell 2000 struggled this week, falling 0.9% to close Friday at 2,806.98, despite a 0.5% rebound in Friday’s session. The small-cap index underperformed the Dow, S&P 500, and Nasdaq, highlighting continued weakness beneath the surface of the broader market. (Source: AP News)
A major headwind was the sharp rise in Treasury yields. Higher borrowing costs tend to weigh more heavily on smaller companies, many of which have greater sensitivity to financing expenses and refinancing needs. The Russell has now suffered five consecutive weekly declines, putting it approximately 9% below its August record high. (Source: The Wall Street Journal)
Richie’s take: The Russell 2000 remains an important test of market breadth. While the major indexes are holding near record levels, small-cap weakness suggests that the rally is not yet receiving uniform participation. I would look for the Russell to stabilize and begin outperforming the larger-cap indexes before concluding that market strength is broadening. Until then, its underperformance remains a cautionary signal.
HYG — Junk Bond Watch
The iShares iBoxx $ High Yield Corporate Bond ETF (HYG) showed modest improvement this week, rising approximately 0.4% to close Friday at $77.23, up from $76.91 the previous Friday. However, the bounce comes after a prolonged period of weakness, with HYG still well below its September levels. (Source: Investing.com)
Richie’s take: HYG remains one of the most important indicators on my watchlist. Although the major equity indexes finished the week higher, high-yield credit has not yet demonstrated a convincing recovery. I want to see HYG establish a bottom and begin moving higher before becoming more comfortable with the rally. If equities continue advancing while HYG weakens, that divergence could be an early warning that the market’s appetite for risk is deteriorating. For now, the equity rally is encouraging, but credit has yet to provide the confirmation I want to see.
Economic Data: Consumer Sentiment Falls to a Five-Month Low
The preliminary October reading for the University of Michigan Consumer Sentiment Index came in at 46.3, a 3.7% (1.8-point) decrease from September. Consumer sentiment sits 13.6% below where it was a year ago and is currently below the 1st percentile in the series’ history. (Source: Seeking Alpha)
Joanne Hsu, director of the University of Michigan’s Surveys of Consumers, commented:
“Consumer sentiment was little changed this month, inching down a scant 1.8 index points from September. While year-ahead expectations for personal finances and business conditions crept up slightly, buying conditions for durables plummeted amid high prices and borrowing costs. Increases in sentiment among Democrats and Republicans were offset by a decline among independents this month. Overall, sentiment for lower-income consumers and those with smaller stock portfolios dropped steeply this month, groups that have fewer resources to weather increases in prices. Frustration over cost-of-living continues to mount, as consumers across the political spectrum believe that the trajectory of the economy has weakened since the beginning of the year.” — Joanne Hsu, Director of Surveys, University of Michigan
This Week's Interesting Sector Piece: Is a Correction Coming Soon?
Source: Seeking Alpha, October 9, 2026—published before Friday’s session (Friday’s close is covered in the recap above). Charts: JR Research via TradingView. The views below are those of the third-party author, not TradeZero or Richard Naso, and are not a guarantee of future market performance or investment advice.
Q4 started confidently as the Nasdaq (QQQ, NDX) went on to establish a new high last week, following the consolidation seen over the previous few weeks. The S&P 500 (SPX, SPY) then followed through, also staging its own all-time highs as October entered its second week. (Source: Seeking Alpha)
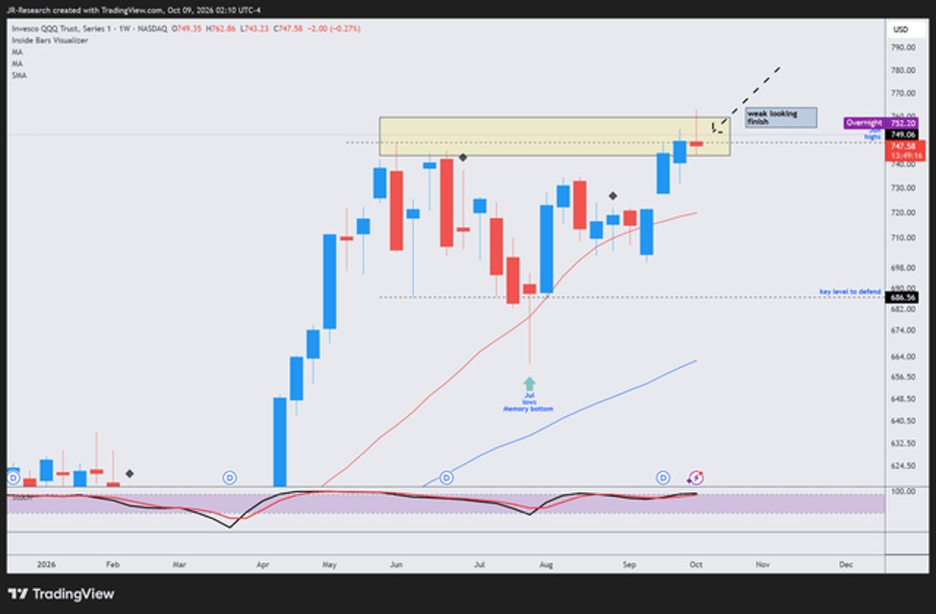
Nasdaq price chart, medium-term (Invesco QQQ Trust, weekly). Chart: JR Research via TradingView, October 9, 2026.
Yet the mood swung as the trading week drew to a close, with both the Nasdaq and S&P 500 encountering enough selling pressure to finish rather meekly, near where the prior week’s price action ended.
The author argues that the narrowly led tech advance could come under more strain as breadth conditions have gone from weakening to cratering lately. Such stresses underneath the market could also lend credence to the weakness observed in other sectors, including financials, industrials, and utilities.
The threat from higher bond yields has not caused tech optimism to plummet. But with weakness on the Nasdaq simmering into the end of the week, conditions could take a turn for the worse if selling intensifies from next week onward.
In the author’s view, current breadth conditions suggest that more and more stocks in the S&P 500 are hanging on by a thin thread, even as index bulls continue to push for the 8,000 milestone by the end of 2026.
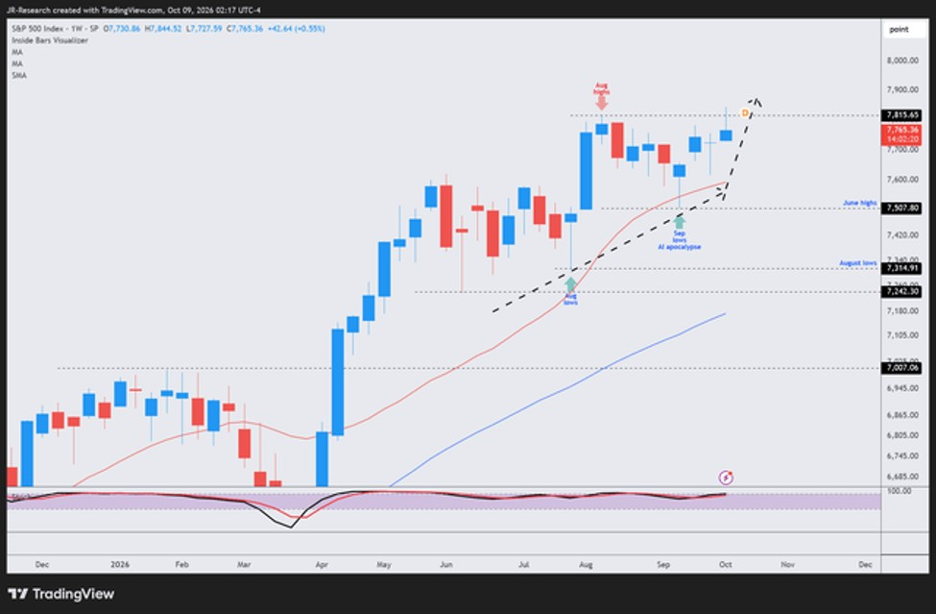
S&P 500 price chart, medium-term (weekly). Chart: JR Research via TradingView, October 9, 2026.
The S&P 500’s performance has trailed the tech-heavy Nasdaq for several weeks, so the retest of its August highs was seen as a watershed moment for the next stage of the advance. Yet the similarities in price action between the Nasdaq and the S&P 500 suggest caution may be warranted, which the author believes raises the odds of a bigger pullback in Q4. With several intertwining headwinds, investors are reassessing their positions carefully.
On My Radar This Week: What I’ll Be Focused On This Week
The items below reflect Richard Naso’s personal areas of focus for the coming week and are provided for informational and educational purposes only. They do not constitute investment advice or a recommendation to trade any security.
WATCH LIST — WEEK OF OCTOBER 12, 2026
- Tuesday and Wednesday — Bank Earnings — JPMorgan, Goldman Sachs, Citigroup, Wells Fargo, Bank of America, and Morgan Stanley begin reporting. Their results and comments on consumers, lending, and capital markets will offer an important read on the economy. (Source: Reuters)
- Wednesday, October 14 — CPI — The September inflation report is the week’s biggest economic test. Headline inflation is forecast around 3.7% year over year. A hotter-than-expected reading could push Treasury yields higher and pressure equities. (Source: Reuters)
- Thursday, October 15 — PPI and Retail Sales — These reports will provide additional insight into inflation pressures and the strength of consumer spending.
Final Thoughts: Richie's Take
As we head into next week, I remain constructive on the market’s longer-term prospects, but I believe a more cautious approach is warranted. The major indexes have shown resilience, yet the strength beneath the surface remains uneven. The Nasdaq has continued to lead, while the recent weakness in semiconductors, the Russell 2000’s underperformance, and the lack of convincing strength in HYG raise questions about the durability of this advance.
The focus now shifts to September CPI, bank earnings, Treasury yields, and the market’s reaction to the incoming data. A favorable inflation reading and solid bank results could provide another catalyst for stocks. However, if yields move higher and credit markets continue to struggle, the market may find it increasingly difficult to sustain its momentum.
Market breadth remains the critical piece of the puzzle. I want to see the advance/decline line improve, small caps and financials participate, and strength extend beyond the largest technology names. A rally supported by a broader group of stocks is far more convincing than one dependent on a handful of market leaders.
My view remains that this market can move higher, but I want confirmation before becoming more aggressive. If breadth improves and HYG stabilizes, the bullish case strengthens. If those indicators continue to deteriorate while the major indexes hold near their highs, I would respect that divergence as a warning sign.
For now, I remain cautiously constructive. The question is no longer simply whether the market can rally, but whether it has the breadth and underlying support to keep that rally going.
— Richie
Disclaimer
This content (“Content”) is produced by Richard Naso. The Content represents only the views and opinions of Mr. Naso who is compensated by TradeZero for producing it. Mr. Naso’s trading experiences and accomplishments are unique, and your trading results may vary substantially from his. TradeZero does not endorse the Content and makes no representations or warranties with respect to the accuracy of the Content or information available through any referenced or linked third party sites. The Content has been made available for informational and educational purposes only and should not be considered trading or investment advice or a recommendation as to any security. Trading securities can involve high risk and potential loss of funds. Furthermore, trading on margin is for experienced investors and traders only as the amount you may lose can be greater than your initial investment. Likewise, short selling as a securities trading strategy is extremely risky and can lead to potentially unlimited losses. Options trading is not suitable for all investors as it can involve risk that may expose investors to significant losses. Please read the Characteristics and Risk of Standardized Options, also known as the options disclosure document (ODD)at before deciding to engage in options trading.
TradeZero provides self-directed brokerage accounts to customers through its operating affiliates: TradeZero America, Inc., a United States broker dealer, registered with the SEC and member of the Financial Industry Regulatory Authority (FINRA) and the Securities Investor Protection Corporation (SIPC); TradeZero, Inc., a Bahamian broker dealer, registered with the Securities Commission of the Bahamas; TradeZero Canada Securities ULC, a Canadian broker dealer, member firm of Canadian Investment Regulatory Organization (CIRO) and member of the Canadian Investor Protection Fund (CIPF); and TradeZero Europe B.V., a Dutch broker dealer, authorized and regulated by the Netherlands Authority for the Financial Markets (AFM) and subject to the regulatory framework of the European Securities and Markets Authority (ESMA) under MiFID II (collectively, the “TradeZero Broker Dealers”).