Three Black Crows Pattern: How Traders Assess Bearish Momentum
May 28, 2026

By Shane Neagle
The Three Black Crows is one of the most widely recognizable bearish candlestick chart patterns. It is made up of three consecutive and long-bodied red handles, which are formed after an established downtrend.
Since the Three Black Crows may indicate a shift in sentiment, where bullish momentum appears to weaken and selling pressure begins to increase, it’s of particular interest to short sellers. This is a pattern that also tends to show up quite frequently in overextended moves or after parabolic rallies, which are often monitored by active traders.
To understand the Three Black Crows pattern, traders may study how to identify it, how to confirm it, and how it is commonly applied.
So, without further ado, let’s begin.
What Are the Three Black Crows?
First, let’s begin with the basic structure of the Three Black Crows pattern. As we briefly touched on, this is generally viewed as a potential bearish reversal signal that appears after an established uptrend. That context is always important, because without a real bullish run leading into it, a three-candle decline can be something else entirely. In other words, the Three Black Crows is meant to show momentum flipping, not simply continuing lower.
As for the pattern itself, it’s formed from three long, bearish candles, all of which open within the previous candle’s body and close lower than the previous candle. This step-down sequence is often interpreted as evidence that selling pressure is increasing over multiple sessions, with buyers unable to push prices back toward prior levels.
Many traders prefer when each candle closes near its low, as this may suggest steady selling pressure into the close and the market isn’t finding meaningful support intraday. That said, the closes do not have to be perfectly at the lows for the pattern to still be valid, especially if the overall structure remains clean and consistent.
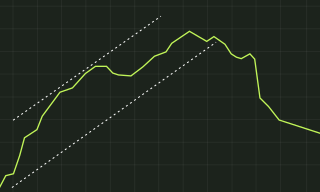
Speaking of cleanliness, all three candles should have relatively small wicks. Smaller wicks are often interpreted as steady selling pressure throughout each session, with limited intraday recovery attempts.
On the whole, the Three Black Crows Japanese candlestick chart pattern is widely recognized as a bearish reversal pattern because it marks a strong, clearly visible shift in sentiment.
Psychology Behind the Three Black Crows
Now, let’s take a minute to analyze the market psychology that underpins the Three Black Crows chart pattern.
After a strong bullish run, the first bearish candle appears as the first sign that buying pressure appears no longer sufficient to sustain higher prices. Unlike, for example, the First Red Day pattern, it’s less about that initial switch, and more about the fact that selling pressure keeps returning and becoming stronger, with enough consistency and strength to cause three consecutive lower closes.
Each candle in the Three Black Crows is a representation of ever-growing dominance on the part of the bears, and may contribute to retracing prior gains. In addition, the formation can potentially trap late buyers, who, chasing the final stage of the uptrend, may feel pressured to exit positions as momentum shifts, driving prices down even further. This, in turn, can cause further stop-loss triggers, and may lead to a total break in confidence.
Short sellers often monitor the Three Black Crows because it is commonly interpreted as a sign that uptrend momentum may be weakening and that bearish pressure is building.
This is also why the pattern often “feels” different from a normal pullback. Across three straight sessions, the market repeatedly signals that bounces are being sold, not bought, which can shift expectations quickly.
As that shift spreads, dip buyers may hesitate, long holders may start exiting to protect gains, and liquidity on the bid can thin out. When that happens, even small sell programs can have a larger impact, and bearish follow-through may occur if fewer participants are willing to buy against the move.
How to Identify and Confirm the Pattern
Before we move on to the methodology used to trade the Three Black Crows, it’s important we take some time out to cover how to correctly identify and confirm this chart pattern.
For starters, there’s the matter of context. The Three Black Crows have to appear after a notable uptrend or extended bullish run. This is a bearish reversal pattern, and if it appears when price action already begins to trend lower, we don’t have bearish reversal, instead, we have a case of continuation on our hands. That uptrend, that context, is what gives the Three Black Crows their fundamental meaning.
Provided that the proper context is present, our next clue lies in the candlestick sequence itself. Traders generally look for three consecutive bearish candles that suggest increasing selling pressure. In practice, this means that each candle closes near its low, below the previous candle’s low, and it should open within or just slightly above the previous candle’s body.
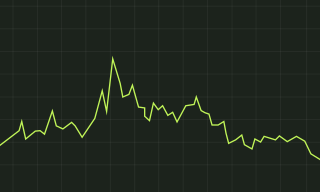
That’s it as far as the basic structure goes: however, we’re still left with the matter of confirming whether or not a signal is legitimate. Our first clue lies in volume analysis. Many traders look for a clear increase in volume during the three bearish candles. This supports the idea that the shift is happening with strong participation, which may provide additional support for the pattern. Unlike neutral consolidation structures such as a symmetrical triangle pattern, the Three Black Crows typically reflects a decisive shift in control rather than market indecision.
Next up, failure to reclaim key resistance levels after the pattern completes is another factor that traders may use when evaluating the pattern. If prices bounce, but cannot reclaim prior levels, bearish sentiment is often reinforced.
Finally, experienced traders know that technical analysis tools and signals should be used in unison. In the case of the Three Black Crows, technical indicators such as moving average convergence divergence (MACD) crossovers, Relative Strength Index (RSI) divergence, or other overbought signals may reinforce the bearish interpretation of the pattern.
How Traders Use the Three Black Crows Pattern for Short Selling
Alright, now that we know how to identify and confirm the Three Black Crows chart pattern, we can now explore how traders commonly apply the pattern. Let’s go through the key elements involved in trading the pattern.
In terms of entries, there are two main approaches. More aggressive traders may consider entering short positions near the close of the third candle, or on a breakdown below the low of the pattern itself. On the other hand, more conservative traders often wait for a reaction bounce. After a three-candle drop, price sometimes attempts a short-lived rebound. In those cases, traders may consider entering on a pullback into resistance or a failed retest of broken trendlines.
Stop-loss orders are a common risk management tool and traders often place them judiciously. More conservative traders tend to place stops above the high of the first candle or the first “crow”, while slightly more aggressive traders place tighter stops above the midpoint of the pattern.
Finally, we come to price targets. Unlike many other chart patterns, there isn’t a singular approach or rule of thumb here. Instead, context is king here: with the Three Black Crows, often reference prior support zones, moving averages, Fibonacci retracement levels, or consult volume-weighted average price (VWAP) for intraday moves.
Before we move on to some of the most common mistakes made when trading the Three Black Crows pattern, it’s important to reinforce the notion that this, like any other tool, isn’t a silver bullet. The Three Black Crows pattern is typically used as part of a broader analytical framework, which includes risk-reward planning, volume analysis, and the use of technical indicators.
Common Mistakes and How to Avoid Them
The single most common error made when trading the Three Black Crows chart pattern is misidentifying the candles. Not all three-candle declines meet the criteria of the Three Black Crows pattern. Ignoring the wider context in which the Three Black Crows appear is the cause of this misstep; so make sure that the formation you’re looking at has formed after a real uptrend.
Traders also frequently make the mistake of entering a short position without confirming the pattern’s validity first. Premature entries may expose traders to reversals, particularly in volatile markets. Another common error is overleveraging. Since even strong reversal signals can peter out during periods of broader market strength, it’s important to keep an eye on position sizing and your use of margin.
Lastly, always remember to keep an eye out for volume. Traders often make the mistake of not checking trading volume, but this metric is both easy to use and useful for evaluating whether a particular signal aligns with broader market context.
Conclusion
The Three Black Crows is a widely recognized bearish reversal pattern that traders interpret as a potential shift in momentum from the bulls to the bears over the course of just three trading sessions.
Still, while it is generally held to be a reliable signal, traders have to keep several key rules in mind when it comes to identifying the pattern’s validity. However, provided that you’re always aware of the proper context in which the Three Black Crows appear, practice proper risk management, and utilize the pattern as part of a broader framework, the pattern may serve as one component of a broader short-selling analysis toolkit.
Disclaimer
This content (“Content”) is produced by Tokenist Media LLC. The Content represents only the views and opinions of Tokenist Media LLC.Tokenist Media LLC’s trading experiences and accomplishments are unique, and your trading results may vary substantially. Tokenist Media LLC is a paid marketing partner of TradeZero that receives compensation from TradeZero for broadcasting, displaying, and/or presenting marketing and sponsorship materials that promote TradeZero. TradeZero does not endorse the Content and makes no representations or warranties with respect to the accuracy of the Content or information available through any referenced or linked third party sites. The Content has been made available for informational and educational purposes only and should not be considered trading or investment advice or a recommendation as to any security.
Trading securities can involve high risk and potential loss of funds. Furthermore, trading on margin is for experienced investors and traders only as the amount you may lose can be greater than your initial investment. Likewise, short selling as a securities trading strategy is extremely risky and can lead to potentially unlimited losses.
Options trading is not suitable for all investors as it can involve risk that may expose investors to significant losses. Please read the Characteristics and Risk of Standardized Options, also known as the options disclosure document (ODD) at https://www.theocc.com/Company-Information/Documents-and-Archives/Options-Disclosure-Document before deciding to engage in options trading. Please also see the Options Trading Disclosure. You must be approved to trade multi-leg options strategies. You may lose all of your principal. Executing multi-leg options orders may result in increased transaction fees compared to single-leg options orders. Multi-leg strategies may exhibit risks such as illiquidity and increased sensitivity to market unpredictability.
TradeZero provides self-directed brokerage accounts to customers through its operating affiliates: TradeZero America, Inc., a United States broker dealer, registered with the Securities and Exchange Commission (SEC) and member of the Financial Industry Regulatory Authority (FINRA) and the Securities Investor Protection Corporation (SIPC); TradeZero, Inc., a Bahamian broker dealer, registered with the Securities Commission of the Bahamas;TradeZero Canada Securities ULC, a Canadian broker dealer, member firm of the Canadian Industry Regulatory Organization (CIRO) and member of the Canadian Investor Protection Fund (CIPF) and TradeZero Europe B.V., a Dutch broker dealer, authorized and regulated by the Dutch Authority for the Financial Markets (AFM) (collectively, the “TradeZero Broker Dealers”).