September Is Not Over Yet
September 21, 2026

Market Recap
Analyzing the markets with Richie Naso, a Wall Street veteran of over 40 years and former member of the NYSE.
a/o September 22nd, 2026
Last Week’s Main Indexes — Let’s Figure This Action Out
Dow Jones Industrial Average
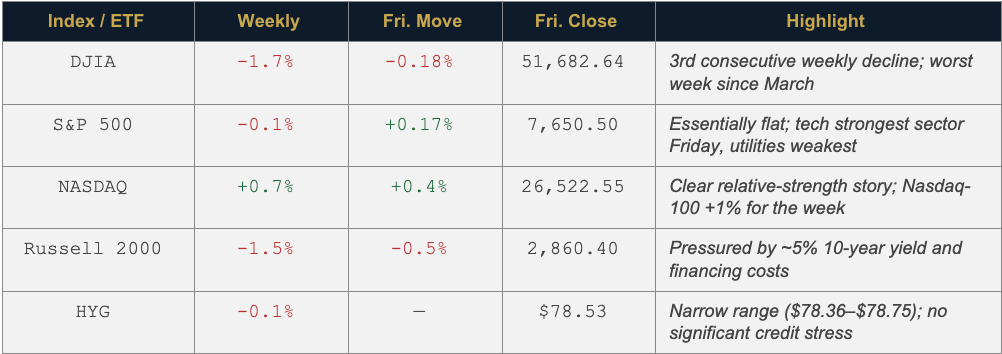
The Dow had a difficult week, falling 890.65 points, or 1.7%, to 51,682.64. That was the Dow’s third consecutive weekly decline and its worst week since March. Friday added to the pressure, with the index falling another 95 points, or 0.18%. (Source: AP News)
Richie’s bottom line: The Dow’s 1.7% weekly decline is notable because it lagged the Nasdaq, which gained 0.7%. The divergence suggests that the week’s selling was not simply a broad-based liquidation — investors continued to favor growth and technology exposure while traditional blue chips faced greater pressure from 5% Treasury yields, $100-plus oil, and renewed inflation concerns.
S&P 500
The S&P 500 finished essentially flat for the week, losing 6.48 points, or 0.1%, to 7,650.50. Friday provided a modest rebound, with the index gaining 12.74 points, or 0.17%. (Source: AP News)
What was particularly interesting was the internal rotation within the market. Semiconductor and technology shares helped support the S&P and Nasdaq, while more economically sensitive and defensive areas struggled. Technology was the strongest-performing S&P sector Friday, while utilities were among the weakest.
Nasdaq
The Nasdaq was the clear relative-strength story this week, gaining approximately 0.7% and finishing Friday at 26,522.55, up 0.4% on the day. That compared with a 1.7% decline for the Dow and a roughly 0.1% decline for the S&P 500. (Source: AP News)
The major driver was technology and semiconductor strength. Chip stocks experienced some volatility early in the week amid concerns about the pace and safety of AI development, but they recovered and helped push the Nasdaq higher. The Nasdaq-100 gained about 1% for the week. (Source: Nasdaq)
Russell 2000
The Russell 2000 had a difficult week, falling 43.55 points, or 1.5%, to 2,860.40. On Friday alone, the index declined 0.5%. (Source: AP News)
The biggest issue for small caps was rising interest rates. The 10-year Treasury yield reached roughly 5%, increasing financing costs for smaller, more debt-dependent companies. That created more pressure on the Russell than on the large-cap S&P 500. (Source: MarketWatch)
HYG — Junk Bond Watch
HYG, the iShares iBoxx $ High Yield Corporate Bond ETF, was relatively stable but weakened modestly this week. It finished Friday at $78.53, down about 0.1% for the week from its September 11 close of $78.60.
The important point is that HYG did not experience significant credit-market stress despite the weakness in equities. The ETF traded in a relatively narrow range, roughly $78.36–$78.75, throughout the week.
Macro Commentary
Positioning for a Fourth-Quarter Rebound
Source: Seeking Alpha — Lawrence Fuller, September 18, 2026. The following summarises Mr. Fuller’s commentary and outlook. These are the views of a third-party analyst, not TradeZero or Richard Naso, and are not aguarantee of future market performance or investment advice.
Key Points
- Stocks and bonds rallied after the Fed’s rate hike, with the 10-year Treasury yield retreating below 5% and oil prices easing inflation concerns.
- Continued improvement in oil and interest rates would provide a strong tailwind for Q3 earnings and could support a move toward new highs in major indexes, in Fuller’s view.
- Market breadth remains weak, with only 31% of S&P 500 constituents above their 50-day moving averages — a caution signal until it turns up.
- Fuller believes rate-sensitive sectors — real estate, utilities, and consumer discretionary — could outperform in Q4 if oil and rates have peaked.
In a delayed reaction, stocks and bonds rallied after the Fed raised its benchmark rate by a quarter point. The major market indexes posted their strongest one-day gains in more than six weeks, and the 10-year Treasury yield fell back below 5% to settle at 4.95%. Oil prices also fell, easing inflation concerns. Investors seem to have regained confidence that the central bank will achieve its mandate for stable prices, and recent strength in the economic statistics suggests it has bought time to do so. One day after an extremely strong retail sales report, weekly unemployment claims fell to just 196,000 — the third-lowest weekly tally in the past year. (Source: Seeking Alpha)
While it is good news that oil and long-term interest rates have edged lower, WTI crude is still flirting with $100 per barrel, and long-term rates remain near their highest level since 2007. If the rate of change continues to improve, Fuller argues, that would be a strong tailwind heading into third-quarter earnings reports. His main concern is that strength in the stock market and the high-frequency economic data could reduce the pressure to de-escalate the conflict with Iran — which he views as the primary reason for today’s inflation problem and the upward pressure on long-term yields.
The stock market, as measured by the equally weighted S&P 500, has pulled back 5% from its all-time high so far in September — consistent with what is typically seen during the worst-performing month of the year, and in line with what Fuller says he was expecting. In his view, whether the market has bottomed has everything to do with oil prices and interest rates, with upcoming earnings reports likely to shift the focus once the calendar moves into October and toward the seasonally strongest part of the year beginning in November.
The percentage of S&P 500 constituents above their 50-day moving average has fallen to 31%. During periods of high volatility, this measure is usually washed out just below this level, though it can fall much further during periods of extreme stress. Fuller writes that he would like to see this percentage turn back up, reflecting an improvement in breadth, before concluding the coast is clear.
The levers for a rebound, he argues, are sustained buying at the long end of the yield curve keeping the 10-year below 5% — supported by strong recent Treasury auctions and retail flows into fixed income — and oil retreating from $100 per barrel, which it has started to do. If both peak and pull back as third-quarter earnings arrive, Fuller believes new all-time highs in the major indexes are possible, with the beaten-down rate-sensitive sectors — real estate, utilities, and consumer discretionary — best positioned to outperform in the fourth quarter. These are his estimates and expectations, not a guarantee of future results.
This Week’s Interesting Sector Piece: Muni Bonds Are Yielding 5%. They Rival Stocks Now.
Source: Barron’s, print edition, p. 11 — Andrew Bary, September 21, 2026. The funds, bonds, and analyst views referenced below are drawn from that article and are included for informational and educational purposes only. They do not constitute investment advice or a recommendation to buy or sell any security. Prices and yields are as of the article’s publication date. Past performance is not indicative of future results.
The global bond selloff has spilled over into the tax-exempt market, with high-grade, long-term municipal bonds now yielding over 5% and offering their highest rates since the 2008–09 financial crisis. (Source: Barron’s)
Munis look appealing for individuals given high absolute yields comparable to those on long-term U.S. Treasuries at a time of strong credit quality throughout the $4 trillion tax-exempt market. For many investors who have favored equities over bonds, the article suggests, a tax-advantaged 5% rate could stack up well versus stocks in the coming years. Yields of 5%-plus are available from a range of high-quality issuers, including the Port Authority of New York and New Jersey and the City of Los Angeles Department of Airports.
“Five percent historically has been a high enough level to attract retail interest and crossover buyers.” — Eric Kazatsky, Client Portfolio Manager, MacKay Shields
Tom Kozlik, head of municipal strategy at Hilltop Securities, points out that the ratio of municipal bond yields relative to Treasuries is at or near 2026 highs, making munis more attractive. Wall Street trading desks were active last week as long-term munis topped 5%.
Tax-equivalent yields on long-term munis with 30-year maturities are 8% to 10%, depending on the tax rates in states where investors reside. In high-tax New York and California, tax-equivalent yields are about 10%, given combined top federal, state, and local tax rates of about 50%. That compares favorably with long-term high-grade corporate bonds yielding 6.5% to 7% and junk bonds at 7% or more.
While there are some pockets of credit weakness among junk-rated muni bonds — such as Brightline, which operates a Florida passenger railroad — overall muni credit quality is strong.
“Municipal credit is in the best shape of my career.” — Dave Hammer, Head of Municipal Portfolio Management, Pimco
One factor pushing muni yields higher is record bond issuance, driven in part by infrastructure projects around the country — the State of Alabama recently sold about $3.7 billion of bonds for a bridge project in Mobile, for example. Total muni issuance is expected to hit a record $600 billion this year, up from $563 billion in 2025.
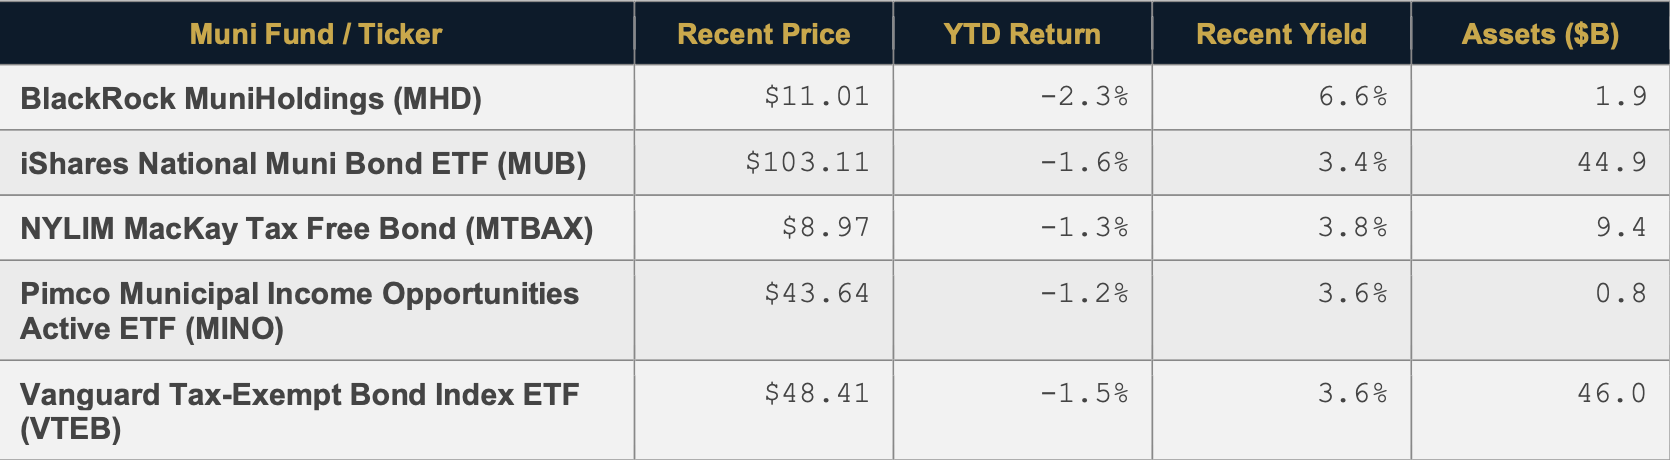
Less Tax, More Yield — Funds and Bonds Cited by Barron’s

Prices, yields, and returns as of the article’s publication date and subject to change. Fund and bond data cited by Barron’s. This table is illustrative only and is not a recommendation of any security.
What I’ll Be Focused On This Week
The items below reflect Richard Naso’s personal areas of focus for the coming week and are provided for informational and educational purposes only. They do not constitute investment advice or a recommendation to trade any security.
WATCH LIST — WEEK OF SEPTEMBER 21, 2026
- Wednesday — PMI Data — A fresh read on business activity as the market weighs how restrictive policy has become.
- The Japan Carry Trade — Something I would be watching very closely right now, particularly after this week’s Bank of Japan move. The BOJ raised its policy rate from 1.00% to 1.25% on September 18 — the highest level in about 31 years — with the new rate taking effect September 24.
The basic carry trade is straightforward: borrow yen at relatively low rates, convert to dollars, and buy higher-yielding assets such as U.S. stocks, bonds, and credit. The trade becomes dangerous when the yen strengthens sharply, because investors have to buy back yen to repay the borrowing — which can force them to liquidate the assets they bought with the borrowed money.
What I’d watch: Yen → Japanese bonds → carry trade → U.S. Treasury yields → Nasdaq/S&P
Final Thoughts: Richie’s Take
As we move into the final full week of September, I remain constructive on the longer-term market, but I am becoming more cautious about the near-term outlook. September has historically been one of the weaker months for equities, and this year we have several additional factors that could increase volatility: Treasury yields near 5%, oil above $100, tighter global monetary policy, and the potential for further unwinding of the Japan carry trade.
One factor I will be watching particularly closely is market breadth. The major averages can remain resilient when a relatively small group of large-cap technology stocks is doing the heavy lifting, but a healthy market ultimately needs broader participation. If the Nasdaq continues to advance while the Russell 2000, financials, and other economically sensitive areas continue to lag, it would suggest that the rally is becoming increasingly narrow. Conversely, an improvement in the advance/decline line, new highs versus new lows, and broader participation across sectors would give the market a healthier foundation.
For now, I don’t see enough evidence to abandon the longer-term bullish case. But I also don’t think this is an environment where I would chase strength. The combination of September seasonality, elevated yields, expensive oil, tightening central banks, and weakening breadth warrants a more cautious approach in the near term.
The key indicators I’ll be watching are Treasury yields, oil, USD/JPY and the Japan carry trade, HYG, the Russell 2000, and, importantly, the breadth of the overall market. If these indicators begin deteriorating together, the risk of a more meaningful correction increases. If breadth improves and participation broadens, it would provide a much stronger foundation for the market to move higher.
My longer-term view remains constructive, but I believe the next few weeks will require patience, discipline, and a willingness to let the market prove that its underlying strength is broadening rather than simply being carried by a handful of large-cap technology names.
- Richie
Disclaimer
This content (“Content”) is produced by Richard Naso. The Content represents only the views and opinions of Mr. Naso who is compensated by TradeZero for producing it. Mr. Naso’s trading experiences and accomplishments are unique, and your trading results may vary substantially from his. TradeZero does not endorse the Content and makes no representations or warranties with respect to the accuracy of the Content or information available through any referenced or linked third party sites. The Content has been made available for informational and educational purposes only and should not be considered trading or investment advice or a recommendation as to any security. Trading securities can involve high risk and potential loss of funds. Furthermore, trading on margin is for experienced investors and traders only as the amount you may lose can be greater than your initial investment. Likewise, short selling as a securities trading strategy is extremely risky and can lead to potentially unlimited losses. Options trading is not suitable for all investors as it can involve risk that may expose investors to significant losses. Please read the Characteristics and Risks of Standardized Options, also known as the options disclosure document (ODD) at theocc.com/Company-Information/Documents-and-Archives/Options-Disclosure-Document before deciding to engage in options trading.
TradeZero provides self-directed brokerage accounts to customers through its operating affiliates: TradeZero America, Inc., a United States broker dealer, registered with the SEC and member of the Financial Industry Regulatory Authority (FINRA) and the Securities Investor Protection Corporation (SIPC); TradeZero, Inc., a Bahamian broker dealer, registered with the Securities Commission of the Bahamas; TradeZero Canada Securities ULC, a Canadian broker dealer, member firm of Canadian Investment Regulatory Organization (CIRO) and member of the Canadian Investor Protection Fund (CIPF); and TradeZero Europe B.V., a Dutch broker dealer, authorized and regulated by the Netherlands Authority for the Financial Markets (AFM) and subject to the regulatory framework of the European Securities and Markets Authority (ESMA) under MiFID II (collectively, the “TradeZero Broker Dealers”).