Rounding Top Pattern: How Traders Evaluate This Gradual Shift in Momentum
May 28, 2026

By Shane Neagle
The Rounding Top is a classic Japanese candlestick chart pattern that is commonly interpreted as a potential bearish reversal pattern. It forms gradually over time at the end of a strong uptrend, and may reflect a shift from strong bullish momentum toward weakening sentiment, with its curved shape denoting how buyers gradually lose strength with each consecutive push higher, finally culminating in a potential market top.
By recognizing the pattern early on, short sellers and momentum traders may monitor for potential breakdowns in overextended tickers ahead of time, instead of having to react after the trend has already shifted. With the right knowledge and tools, traders may observe signs of fading bullish momentum, weakening rallies, and potential support breaks.
In this article, we’ll do our best to help TradeZero’s technically focused traders in search of pattern-based setups understand how to analyze and apply the Rounding Top pattern, with a focus on proper entry timing and proper risk management.
What is a Rounding Top Pattern?
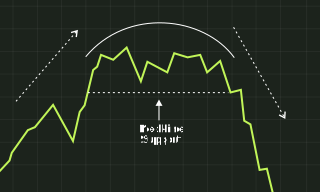
Let’s start with the Rounding Top’s basic structure. This pattern is generally viewed as a potential bearish reversal formation that takes the shape of a smooth, dome-shaped structure in which price action rises, gradually flattens near the top, and then experiences a symmetrical decline.
In other words, we have strong bullish momentum which stalls out, followed by a flattening of momentum and finally a downward slope.
The most important thing to keep in mind is the pattern’s character. This is a reversal setup, and suggests a possible change in momentum, rather than continuation. What the Rounding Top tells us is that a prevailing uptrend is weakening and that it could transition into a downtrend.
Rounding Tops typically appear on daily or longer-term charts, where it’s easier to spot a gradual yet sustained weakening of bullish sentiment. The pattern often forms after a stock has experienced a prolonged rally or a parabolic run, and as these are, at least on paper, commonly monitored by short sellers evaluating potential setups, it’s little wonder that short sellers keep an eye out for Rounding Tops.
An important thing to note is that, unlike most chart patterns, the Island Reversal can occur in both uptrends and downtrends. However, the signal is generally considered more meaningful when it appears after a strong uptrend and hints at a bearish reversal. Since this is both the most common and most meaningful form of the pattern, we will focus solely on this variation, the one relevant to short selling, in this article.
With that being the case, the version of the pattern we’ll be focusing on occurs after a strong upward move, and may reflect a rapid shift in conviction.
Psychology Behind the Rounding Top
Now, let’s take a minute to discuss the market behavior characteristic of a Rounding Top through the lens of trading psychology. Generally, traders view this pattern as reflecting a gradual shift in sentiment.
To expand on what we just said, in the early phase of the pattern, the bulls are driving prices upward, but what’s interesting is that with each consecutive move, the driving force falters. While the first few rallies are strong, the ones that follow them lose intensity. As this goes on, momentum no longer carries the same significance, even though the uptrend remains intact. It’s a subtle change, and often goes unnoticed at first, but traders often consider it meaningful.
As we approach the midpoint of the pattern, the bulls and the bears reach a point of temporary balance. Buying and selling are roughly even, and this equilibrium marks the formation of the top area of the structure. With flat price action and decreased volatility, neither of the two sides has a clear advantage at this point in time.
This also marks a turning point. As a clear sign of hesitation, the top of the pattern tends to reduce bullish sentiments even further.
In the last phase of the pattern, selling pressure gradually rises, and as buyers lose conviction on account of an increasing number of failed rallies, the right side of the pattern begins to slope downward, potentially leading to a breakdown.
With such a clear and gradual progression in sentiment, the pattern is of great interest to patient short sellers. As the pattern unfolds slowly, traders may attempt to anticipate potential reversals rather than reacting after the fact to them once they’re already underway.
How to Identify and Confirm a Rounding Top
The first step is looking for a gradual upward curve that forms across an uptrend. That steady upward slope should begin to lose strength and eventually flatten into a rounded top in which prices stall. From there, the pattern continues with a decline that mirrors the initial upward curve. In addition, it’s important to remember that the progression should be smooth, not sharp, as traders typically look for a slow transition from buying strength to selling pressure, not a sudden and dramatic shift.
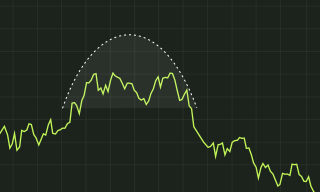
Another key contextual clue might be found through volume analysis. In general, traders are looking for an increase in volume during the initial ascent, as bullish momentum builds. As the top of the pattern forms and momentum weakens, volume should decrease. Finally, when the breakdown begins on the right side of the pattern, volume should rise again, suggesting that a shift toward a downtrend may be underway.
A key confirmation signal occurs when prices break below the neckline or base support level that forms along the lows of the pattern. This is often interpreted as a sign that selling pressure has strengthened, and as it marks the point of a confirmed breakdown, it also may help traders avoid premature entries.
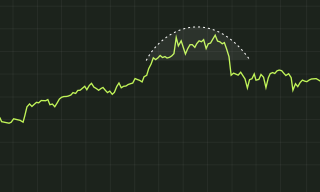
Traders also often turn to technical analysis for additional confirmation. Technical indicators such as moving averages (MAs), the Relative Strength Index (RSI), or Moving Average Convergence Divergence (MACD) crossovers can offer an additional layer of insight as to whether momentum is truly weakening.
How to Trade the Rounding Top Pattern
We’ve covered how traders identify the Rounding Top pattern. Now, it’s time to turn to some practical considerations for how traders may approach the pattern.
Let’s begin with entry points. More conservative traders tend to wait for a clean break below the pattern’s neckline. This, as we mentioned, may help reduce the likelihood of early entries. On the other hand, more aggressive traders sometimes opt to open short positions earlier, usually when the right side of the pattern begins sloping downward. While this approach may provide different entry opportunities, it also comes with more risk, and necessitates the use of tighter stops.
Speaking of stop-loss placements, the most common approach is to place a stop just above the top of the pattern, as that marks the point at which a recovery would invalidate the wider setup. Beyond that, traders sometimes choose to place stops at the nearest clear resistance level above their entry point, which provides a tighter but still meaningful stop.
What about price targets? One common approach involves measuring the distance from the top of the Rounding Top pattern to the neckline, and project that distance downward from the point at which the breakdown occurs. However, plenty of short sellers also choose to refine their price targets by factoring in prior support zones or Fibonnaci extension levels.
The key thing to remember is that patience is of the utmost importance. Rounding Tops form slowly, so while the waiting game can be taxing, choosing to wait for a clear breakout on strong volume is often considered a more cautious approach.
Common Mistakes and Best Practices
As we can see, the Rounding Top Japanese candlestick pattern offers plenty of advantages: however, being aware of common mistakes and pitfalls is essential for improving execution and avoiding false setups.
We’ve already touched on the more aggressive approach that centers on entering a trade early. While this method may appear tempting, it is also the most common error traders make, as his approach carries more risk compared to waiting for a clear breakdown, seeing as how it exposes traders to the possibility of getting captured in a false move.
Ignoring volume clues can present yet another common misstep. Volume analysis provides an important layer of confirmation when it comes to this pattern. Rounding Tops that do not experience increased trading volume during the breakdown may be viewed as weaker signals compared to those that do.
Another common error may stem from ignoring the wider context in which the Rounding Top pattern forms. While the structure of the pattern does hint at reversal, broader market strength can override this. Traders sometimes compare the rounding top to the head & shoulders pattern, another well-known bearish reversal setup that also depends heavily on context for confirmation.
Simply put, trying to trade the Rounding Top in the middle of a strong bull market or at points that are not close to clear zones of resistance may result in setups that traders view as lower conviction.
As always, risk management is essential. Since Rounding Tops can lead to false breakdowns or even temporary rebounds, judiciously placing stops and keeping an eye on proper position sizing is commonly required to keep the risk/reward ratio of a trade acceptable.
Finally, it’s worth noting that, like any other technical analysis tool, the Rounding Top chart pattern is not meant to be used on its own. Volume analysis and technical indicators such as Moving Averages, the Relative Strength Indexes, and Moving Average Convergence Divergence are often used by traders as part of a broader evaluation, as they can provide an additional layer of insight into market dynamics.
Conclusion
The Rounding Top chart pattern may offer traders insight into how momentum shifts, and bullish sentiment changes into bearish sentiment. However, utilizing it effectively requires discipline, patience, and consistent risk management.
Owing to its gradual formation and clear shape, the Rounding Top may provide a structured framework that traders use when planning entries, stops, and price targets. With that being said, short sellers should remember to use the pattern in tandem with a variety of tools and indicators for a more detailed and holistic analysis.
Disclaimer
This content (“Content”) is produced by Tokenist Media LLC. The Content represents only the views and opinions of Tokenist Media LLC.Tokenist Media LLC’s trading experiences and accomplishments are unique, and your trading results may vary substantially. Tokenist Media LLC is a paid marketing partner of TradeZero that receives compensation from TradeZero for broadcasting, displaying, and/or presenting marketing and sponsorship materials that promote TradeZero. TradeZero does not endorse the Content and makes no representations or warranties with respect to the accuracy of the Content or information available through any referenced or linked third party sites. The Content has been made available for informational and educational purposes only and should not be considered trading or investment advice or a recommendation as to any security.
Trading securities can involve high risk and potential loss of funds. Furthermore, trading on margin is for experienced investors and traders only as the amount you may lose can be greater than your initial investment. Likewise, short selling as a securities trading strategy is extremely risky and can lead to potentially unlimited losses.
Options trading is not suitable for all investors as it can involve risk that may expose investors to significant losses. Please read the Characteristics and Risk of Standardized Options, also known as the options disclosure document (ODD) at https://www.theocc.com/Company-Information/Documents-and-Archives/Options-Disclosure-Document before deciding to engage in options trading. Please also see the Options Trading Disclosure. You must be approved to trade multi-leg options strategies. You may lose all of your principal. Executing multi-leg options orders may result in increased transaction fees compared to single-leg options orders. Multi-leg strategies may exhibit risks such as illiquidity and increased sensitivity to market unpredictability.
TradeZero provides self-directed brokerage accounts to customers through its operating affiliates: TradeZero America, Inc., a United States broker dealer, registered with the Securities and Exchange Commission (SEC) and member of the Financial Industry Regulatory Authority (FINRA) and the Securities Investor Protection Corporation (SIPC); TradeZero, Inc., a Bahamian broker dealer, registered with the Securities Commission of the Bahamas;TradeZero Canada Securities ULC, a Canadian broker dealer, member firm of the Canadian Industry Regulatory Organization (CIRO) and member of the Canadian Investor Protection Fund (CIPF) and TradeZero Europe B.V., a Dutch broker dealer, authorized and regulated by the Dutch Authority for the Financial Markets (AFM) (collectively, the “TradeZero Broker Dealers”).